
Backwater and tides: when river level stops meaning flow
What the backwater effect is, why a stage-discharge rating fails when the downstream end of a river moves, and how hydrologists measure flow in those conditions.

A gauge on a river upstream of a reservoir, a confluence or the sea shows the level rising overnight. The control room reads it as more flow coming down. But the rain has not changed, and the discharge upstream may be the same as yesterday. The level rose because something downstream held the water back. This is the backwater effect, and it is the main reason a river level cannot always be turned into a flow. This article explains what the backwater effect means, how tides produce a similar result, what the backwater curve looks like, and how discharge is measured when the usual rating curve no longer works.
What is the backwater effect?
The backwater effect is the raising of the water level in a river reach by something downstream that obstructs or controls the flow. The water upstream has to deepen to push the same discharge through. Typical causes are a downstream reservoir or dam, a larger river at a confluence, a bridge or other obstruction, ice, and the tide [1][2].
The key idea is control. Under normal conditions in a river with subcritical flow (flow slower than the speed at which a surface wave travels), the stage at a gauge is set by a control just downstream: a rock riffle, a narrow section or a weir. One level then corresponds to one discharge. That is what a rating curve (stage-discharge relation) assumes. We explain how these curves are built and how uncertain they are in rating curves and their uncertainty.
Backwater breaks the assumption. The US Geological Survey (USGS) manual on streamflow computation puts it plainly: if variable backwater or highly unsteady flow exists at a gauging station, the energy slope is variable at a given stage and the discharge rating cannot be defined by stage alone [3]. In the WMO manual on stream gauging, variable backwater is listed as a complication affecting stable and unstable channels alike, and the sources named are downstream reservoirs, tributaries, tides, ice, dams and other obstructions [1].
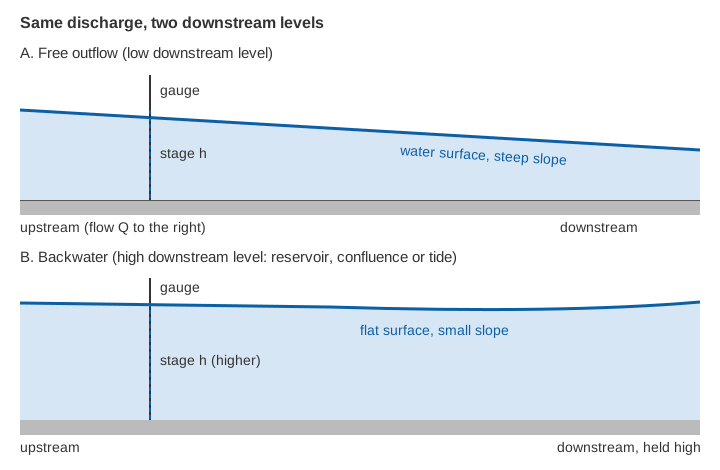
Why does the same flow give different levels?
Think of the water surface as a slope. Flow is driven by that slope, and by the depth and roughness of the channel. If the downstream end is held high, the surface flattens, and a flatter slope can only carry the same discharge at a greater depth. So the gauge reads higher without any extra water.
In the USGS manual's words, where a confluent stream acts as a control, the stage at the gauge "will no longer be related solely to the discharge of the main stream, but will also vary with variation of the discharge in the confluent stream" [3]. The same manual adds that at gauging stations on tide-affected streams, the tide itself must be considered a variable control element [3].
What is the backwater curve, and how far does it reach?
A backwater curve is the profile of the raised water surface, from the obstruction upstream to the point where the river returns to its natural (normal) depth. It approaches that depth gradually and never abruptly. Engineers compute it with the "step backwater method", which starts at the downstream level and works upstream reach by reach using surveyed cross-sections [1].
How far upstream does the effect go? For a rough sense of scale, the length is of the order of the depth divided by the bed slope. This is an order-of-magnitude estimate, not a design formula.
Backwater length ~ depth / bed slope     (illustrative order of magnitude)

Lowland river:    depth 3 m, slope 0.0005 (1 in 2,000):   3 / 0.0005 = 6,000 m  (about 6 km)
Foothill river:   depth 2 m, slope 0.005 (1 in 200):      2 / 0.005  =   400 m
Hill stream:      depth 1 m, slope 0.02  (1 in 50):       1 / 0.02   =    50 m
In a steep Himalayan stream a downstream obstruction usually affects only a short distance, so a gauge a few hundred metres upstream may be safe. In a flat valley or a delta the same obstruction can be felt for kilometres. A gauge near a reservoir tail, or in the lower reaches of a river that meets a larger one, deserves a closer look, however steep the catchment is higher up. We discuss hill-catchment conditions in river monitoring in hill and Himalayan catchments.
How do tides affect a river's level and flow?
Tides push the downstream boundary of a river up and down once or twice a day. Near the sea, the level at a gauge then follows the tide as well as the river, and the flow can slow, stop or even reverse during the flood tide. A rating curve cannot describe this: for a given stage there are many possible discharges, depending on whether the tide is rising or falling.
Tidal effects reach further than the daily rise and fall suggest. Tides superimposed on river flow can produce water-level variations with periods of a fortnight or longer, which may not be recognised at first as tidal in origin, and the resulting set-up of water level can act as backwater even beyond the point where the tide itself dies out [2]. In India, the lower Hooghly is a well-known tidal river, where a tidal bore forms in the upper estuary [4]. Other rivers that drain to the coast, including the delta reaches of the east-coast rivers, face the same issue near their mouths.
A worked case shows how large the error can be. At a station on the Mahakam River in Indonesia, about 300 km upstream of the river mouth, the level was affected by backwater from lakes, tributaries and floodplain ponds, as well as by tides. A conventional stage-discharge relation did not capture the discharge dynamics measured by a horizontal acoustic Doppler profiler, and for a given river stage the discharge range could be as high as 2,000 m³/s, which the authors found far beyond what kinematic-wave dynamics could explain [2].
How is discharge measured under backwater and tides?
Two families of methods are used. One adds a second measurement to the level. The other measures the velocity of the water directly. The WMO manual covers both in separate chapters, as "discharge ratings using slope as a parameter" and "discharge ratings using the velocity index method" [1].
Slope (fall) ratings: a second gauge
If the backwater is caused by a downstream tributary or a reservoir, a second gauge a known distance downstream measures the fall, the difference in water level between the two gauges. The discharge is then a function of both stage and fall. In the form given in the WMO manual, the discharge at a measured fall is the base-rating discharge adjusted by the ratio of the measured fall to a reference fall [1]:
Qm / Qr = (Fm / Fr)^n

Qm = discharge at the measured fall      Qr = discharge from the base rating at that stage
Fm = measured fall between two gauges    Fr = rating fall of the base rating
n  = about 0.4 to 0.6; theoretical value 0.5 [1]
Illustrative example. At some stage the base rating gives Qr = 100 m³/s for a rating fall of Fr = 0.30 m. The gauges now show a fall of only Fm = 0.12 m because the downstream level has risen:
Qm = 100 × (0.12 / 0.30)^0.5 = 100 × 0.632 = 63 m³/sThe stage alone would have suggested 100 m³/s. The rated discharge is about 37 % lower.
The method has practical limits. The WMO manual notes that the fall from two gauge records may not represent the true surface slope, because bends, changes in cross-section and the backwater itself curve the surface [1]. The reach should be as far upstream of the backwater source as practicable, and the inflow between the gauges negligible [1]. Where the slope is very small, as in lowland rivers, the fall can drop below the accuracy of the level gauges. A study cited by Hidayat and co-authors estimated that gauges would need to be 2,000 to 5,000 m apart where the bed slope is 1 in 100,000 [2]. For a meandering lowland river, those authors concluded that the two-gauge approach is suboptimal [2].
Index velocity: measuring the flow directly
The second approach does not rely on slope at all. In the index velocity method, a sensor measures the water velocity in part of the section, the "index" velocity. A relation, built from reference discharge measurements, converts that to the mean velocity of the whole section. A separately surveyed relation between level and cross-sectional area gives the area, and discharge is the product of the two [1][5].
The USGS guide to the method says it is especially appropriate where more than one discharge can occur at a given stage, which is the situation under tides and variable backwater [5]. USGS also describes its use on tidal rivers, where discharge is computed in two steps, area from the measured level and mean velocity from the index velocity, and the daily mean is then taken from a low-pass filtered series [6].
The method has its own demands. Reference discharge measurements must cover the range of conditions, and the relation must be checked from time to time [1][5]. In the Mahakam study the index velocity relation was calibrated against boat-mounted profiler surveys [2].
Which method suits which site?
| Situation | What the level alone tells you | Usual approach |
|---|---|---|
| Steep hill stream, control just downstream | One level, one discharge | Ordinary stage-discharge rating [1] |
| Gauge upstream of a confluence or reservoir tail | Level also depends on the downstream level | Slope (fall) rating, or velocity index [1] |
| Lowland river with small slope | Level depends on downstream conditions and on changing flow | Velocity index; two-gauge methods are weak [2] |
| Tidal reach | Many discharges for one level, flow may reverse | Velocity index, or an unsteady-flow model with gauges at both ends [1][3][5] |
Key points
- The backwater effect raises the level upstream of an obstruction, a confluence, a reservoir or the sea, without any increase in flow.
- A stage-discharge rating assumes one level gives one discharge. Backwater and tides break that assumption.
- The reach affected scales roughly with depth divided by bed slope, so it is short on steep hill streams and long on flat rivers and deltas.
- Slope (fall) ratings add a second gauge; index velocity measures flow directly and suits tidal reaches.
- Gaugings at the same stage that disagree, or a level that moves while an upstream gauge stays steady, are the first signs of backwater.
Where ClimMaTech fits
At ClimMaTech we treat a level record as evidence of flow only where the site justifies it. PRAVAAH is a non-contact sensor that combines an AWLR (Automatic Water Level Recorder) with an SVR (Surface Velocity Radar), so level and surface velocity are recorded together at the same section, which helps show when the two stop moving in step. Our river monitoring page describes how we plan stations along a river, including sites near confluences and reservoirs.
References
- World Meteorological Organization, Manual on Stream Gauging, Volume II: Computation of Discharge, WMO-No. 1044, 2010 (chapters 1 to 4: variable backwater, velocity index method, slope ratings, tidal streams). wmo.int (PDF). Volume I: PDF
- H. Hidayat, B. Vermeulen, M. G. Sassi, P. J. J. F. Torfs, A. J. F. Hoitink, Discharge estimation in a backwater affected meandering river, Hydrology and Earth System Sciences 15, 2717–2728, 2011. doi:10.5194/hess-15-2717-2011
- S. E. Rantz and others, Measurement and Computation of Streamflow, Volume 2: Computation of Discharge, USGS Water-Supply Paper 2175, 1982 (chapters 11 and 13). pubs.usgs.gov (PDF)
- T. Roy-Biswas, D. Sen, Tidal Bore Dynamics of a Mixed Estuary: The Hooghly River, India, Journal of Waterway, Port, Coastal, and Ocean Engineering 149(1), 2023. doi:10.1061/(ASCE)WW.1943-5460.0000730WW.1943-5460.0000730)
- V. A. Levesque, K. A. Oberg, Computing discharge using the index velocity method, USGS Techniques and Methods 3-A23, 2012. pubs.usgs.gov/tm/3a23
- C. A. Ruhl, M. R. Simpson, Computation of discharge using the index-velocity method in tidally affected areas, USGS Scientific Investigations Report 2005-5004, 2005. doi:10.3133/sir20055004