
Data quality control for hydromet time series: spikes, gaps, flat lines and drift
The faults that creep into water-level and rainfall records, what causes them, the automatic checks that catch them, and how to flag and correct data without ever losing the original.

An automatic station sends a value every few minutes, year after year, mostly without anyone looking at it. Most values are right. Some are not: four metres on a dry-season morning, a level that does not move for six hours while it rains hard upstream, a rain gauge reporting nothing during a storm its neighbours all recorded. Fed into a flood warning, a rating curve or a design study, such values do damage. This article covers the common faults in level and rain records, their causes, the checks that find them, and how to correct data so others can follow the work years later.
Why quality control matters, and what it is
Quality control (QC) is the process of checking and validating data. It is narrower than quality assurance, which also covers training, best practice, corrective action and audit. The WMO Guide to Hydrological Practices (WMO-No. 168) makes this distinction and sets out a principle that runs through everything below: a hydrologist must take "a conservative attitude" to altering data, and any correction must rest on evidence, not guesswork [1].
Two further points from the Guide are worth keeping in mind. First, computerised validation "can never be fully automated to the extent that the hydrologist need not check the flagged values". Second, "the most extreme values may prove to be correct and, if so, are vitally important" [1]. A QC system that discards unusual values discards exactly the flood peaks a warning service exists for.
The common faults and their usual causes
The chart is a synthetic record with the common faults packed into a few days so they can be seen together. Real faults are rarer, and drift usually builds between site visits, not within hours.
Spikes
A spike is an isolated value far from its neighbours that returns to normal at the next reading. Causes include a non-contact sensor seeing debris or waves (the USGS notes that radar gauges are often affected by waves [2]), electrical interference and a corrupted message in transmission. The WMO Guide notes that a physical or electronic fault often produces a "grossly high or low value (perhaps maximum possible or zero)" [1].
Gaps, and gaps disguised as zeros
A gap is a period with no data: a flat battery, a telemetry outage or a failed download (the USGS lists data retrieval as a source of both wrong readings and lost data [2]). Gaps are honest. The danger is a gap that does not look like one. The WMO Guide warns that if a missing value is left blank, "databases may automatically infill a (misleading) zero", and that it is "extremely important to differentiate between data that are missing and data that were recorded as having a zero value" [1]. For rainfall, a zero says "no rain fell"; a gap says "we do not know". Software may also interpolate silently across missed values, turning a gap into a straight line [1].
Flat lines (stuck values)
A flat line is a run of identical values where the real quantity should be changing. The WMO Guide lists causes such as a sticking float cable, a sensor at the limit of its range, or a wrongly interpolated gap [1]. A logger that keeps sending its last good value after the sensor stops responding looks the same. The most dangerous case is the one in the chart: a level that freezes on the rising limb of a flood.
Step shifts
A step shift is a sudden, lasting offset: the record jumps and carries on with the same shape, only higher or lower. Common causes are a sensor or bracket that has been knocked, re-mounted or re-programmed with a different offset. The USGS notes that a gauge can also move through uplift or settlement of its support, and that such datum errors "can only be detected by running levels" to reference marks [2]. A batch that sits higher or lower than the data on either side may also have been processed with a wrong correction or offset [1].
Drift
Drift is a slow departure from the truth, and the hardest fault to see by eye, because each reading looks reasonable on its own. Submersible pressure transducer readings vary with water temperature and density [2]. Floats can leak and float-tape clamps can slip, which the USGS notes usually makes readings too low [2]. Silt in a stilling-well intake makes the recorded level lag the river and gives "sluggish" peaks [1][2]. A regular daily oscillation in a pressure-sensor record may point to moisture in the sensor rather than a real signal [1].
Time-stamp errors
A value can be right and still be filed at the wrong time. Typical causes are a logger clock that drifts or resets after a power loss, a mix-up between Indian Standard Time and UTC (IST is five and a half hours ahead), and duplicate or out-of-order records when buffered data arrive late. The WMO Guide notes that tabulated daily data make it easy to spot stations "consistently credited to the wrong day" [1], and Durre and colleagues describe this kind of date "shifting" as a known problem in daily observations [3].
Impossible values
Some values cannot be true under any conditions: negative rainfall, a water level below the bed of the channel, a date of 31 April, or a reading beyond the measuring range of the sensor. The WMO Guide calls tests for these absolute checks: values that fail them "must be incorrect" [1].
Automatic checks
Automatic checks do not decide what is true; they decide what a person should look at. The WMO Guide groups them into absolute checks and three kinds of relative checks: expected ranges, maximum expected change between successive observations, and maximum expected difference between adjacent stations, plus physio-statistical checks that compare related variables, such as water level against rainfall [1].
The table lists the checks we find most useful for level and rain stations. All thresholds are examples only: each site needs its own, worked out from its record, channel and sensor.
| Check | What it catches | Example rule (to be tuned per site) |
|---|---|---|
| Range (absolute) | Impossible values, sensor out of range | Flag level below channel bed or above sensor range; flag rain < 0 mm |
| Range (climatological) | Values unusual for the season | Flag a level above the highest level on record for that month, for review (not rejection) |
| Rate of change | Spikes, sudden steps | Flag a level change above about twice the largest 15-minute change in the station's checked history |
| Persistence (flat line) | Stuck sensors, interpolated gaps | Flag 12 or more identical 15-minute level values (3 hours) during the monsoon |
| Missing data | Gaps, zeros written for gaps | Flag any expected time step with no record; flag runs of exact zeros in level |
| Time stamp | Clock errors, duplicates | Flag duplicate or out-of-order times and a logger clock more than a few minutes from network time |
| Internal consistency | Disagreement between related values at one station | Flag a level rise of more than 0.5 m with no rain at the station or upstream in the previous 24 hours |
| Spatial consistency | Faults at one station, local blockages | Flag a daily rain total above 20 mm when all of the three nearest gauges record zero |
| Manual reference | Drift, steps, datum error | Compare every staff-gauge reading at a site visit with the logged value; flag a difference above 2 cm |
A worked example: setting a rate-of-change threshold
Suppose a hill-river station's checked record shows that the largest real rise in any 15 minutes, over several monsoons, was 0.30 m. An example rule flags any change larger than twice that:
threshold = 2 × 0.30 m = 0.60 m per 15 minutesA rise of 0.45 m passes. A jump of 2.9 m, like the spike in the chart, is flagged. The factor of two is a choice. The WMO Guide advises starting with tolerance limits "fairly broad", but not so broad that flags become unmanageable, and tightening them as statistics build up; it also notes that a step threshold may need to vary with stage [1].
Try it on a short synthetic 15-minute record with one spike and a real flood rise. Too low a threshold flags the real rise. A simple change test also flags the good value just after the spike; a two-sided spike test does not.
How strict should a check be?
Every check trades missed errors against false positives: good values wrongly flagged. Durre and colleagues, who built the automated QC for the global daily climate dataset GHCN-Daily, tuned each of their 19 tests so that no more than one in five flagged values was a false positive. The full system flagged 0.24 % of more than 1.5 billion values, with an overall false-positive rate of 1 to 2 % [3]. Their thresholds are generous: a temperature spike must differ by at least 25 °C from both the previous and following day [3]. They also ran the checks in a deliberate order, each ignoring values already flagged by an earlier one [3]. For a level or rain network, that suggests running simple checks (range, missing data, time stamps) first.
Checks between stations and between variables
Spatial checks work well for stations on the same river, though on larger rivers the upstream data must first be lagged by the travel time [1]. Hill-country rainfall varies sharply over short distances, so spatial rain checks should send values to review, not reject them. The Guide also suggests plotting rain against stage or flow to find rises without rain, and rain without any response [1]. For faults specific to rain gauges, see tipping-bucket rain gauge errors, siting and calibration.
Manual review
Automatic checks narrow the search; a person makes the decision. The WMO Guide states that "visual checking of plotted time series of data by experienced personnel is a very rapid and effective technique for detecting data anomalies", and that overplotting adjacent stations is "a very simple and effective way" of checking consistency [1]. Its minimum checks for stage include comparing the record with manual readings taken at each visit and looking at hydrograph shapes for straight lines, steps, spikes, and floods or recessions where none should be. It recommends checking stage separately and before flow [1], since every stage error passes into discharge through the rating curve. Before correcting anything, look for an explanation already on file, such as a field note [1].
Never overwrite the raw data
This is the most important rule. The WMO Guide lists the stage data "in their original unmodified form" first among the data that should be preserved, and says that for logged data "the originally recorded file should be archived, and a copy edited" [1]. USGS guidelines for continuous monitors state that "original data must be preserved in its original form, regardless of how the data may be modified later" [4].
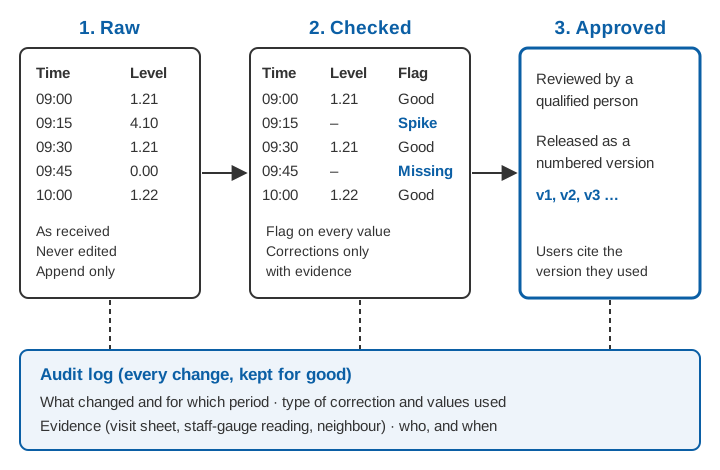
A correction may later prove wrong, as when a "spike" turns out to be a real flash flood; methods improve and records get reprocessed. A simple structure that works:
- Raw layer. Every value exactly as received, with the time it arrived. Never edited, only appended.
- Checked layer. A copy of the raw data with a quality flag on every value and corrections applied where justified.
- Approved layer. The checked data after a qualified person has reviewed it, released as a numbered version.
Flag, correct, document
Flags
A quality flag is a short code stored with each value. The WMO Guide gives an example set: E (estimated), U (uncertain, thought to be incorrect but cannot be verified), G and L (above or below a measurement limit) and V (outside the normal range but checked and verified) [1]. The V flag matters: it records that an extreme value was examined and accepted, so no one deletes it later.
Corrections
Correct only with evidence. For drift, the evidence is usually a reference reading at a site visit. The USGS method for continuous monitors applies zero correction at the start of the period and the full correction at the end, interpolating linearly between [4]; the same approach suits a level sensor checked against a staff gauge. An illustrative example: at one visit the logger and staff gauge agree; 30 days later the logger reads 1.62 m and the staff gauge 1.50 m, so the logger is 0.12 m high. The prorated correction at day t after the first visit is:
correction(t) = −0.12 m × t / 30
day 10:  −0.04 m
day 20:  −0.08 m
day 30: −0.12 mReal drift is rarely perfectly linear, so a linear ramp is a best estimate, and the corrected values should carry a flag saying so.
A step shift is corrected with a constant offset from the moment of the step to the next reference reading.
Gaps need the most restraint. The WMO Guide warns that filling missing data with estimates "can severely compromise its value for certain purposes", and that filling must be traceable and reversible [1]. It reproduces strict New Zealand criteria under which a water-level gap may be filled with a line only if, among other conditions, the river was in natural recession and no significant rain fell; filling from an adjacent station required a correlation of 0.99 or better [1]. A filled flood peak is a guess, and should be flagged as one.
Documentation, audit trail and versions
The WMO Guide sets a clear test: any alteration should be recorded so that others can follow what was done and why, and "it should not be necessary to refer to the persons who made the alteration for an explanation" [1]. In practice each correction needs:
- the period and the station and variable it applies to;
- the type of correction and the values used;
- the evidence (visit sheet, reference reading, neighbouring station);
- who made it and when.
Recording corrections as a script, not hand edits, makes them repeatable; Horsburgh and colleagues describe open-source software built so that "data editing steps are traceable and reproducible" [5]. Released datasets should carry a version number, so a study can state which version it used.
Key points
- Most faults are spikes, gaps (including gaps disguised as zeros), flat lines, step shifts, drift, time-stamp errors or impossible values, each with typical causes.
- Automatic checks (range, rate of change, persistence, internal and spatial consistency) select values for review. They do not decide what is true.
- Thresholds must be tuned per site, starting broad and tightening as the record grows. Extreme values can be real and are often the most valuable.
- Visual review of plots, with neighbours and field readings overplotted, remains among the most effective checks.
- Never overwrite raw data. Keep raw, checked and approved layers, flag every value, and record every correction with its evidence.
Where ClimMaTech fits
Quality control starts at the station and continues on the server. Our real-time data acquisition and telemetry solution brings water-level and rain data in from the field, and Visiflow (Device Cloud) is where those records are stored, viewed and checked. For the basics of how such a network is put together, see what an RTDAS is.
References
- World Meteorological Organization, Guide to Hydrological Practices, Volume I: Hydrology – From Measurement to Hydrological Information, WMO-No. 168, 2008 edition, updated in 2020, Chapter 9 (Data processing and quality control). WMO Hydrology Publications page; full text: copy hosted by Agência Nacional de Águas, Brazil.
- V. B. Sauer and D. P. Turnipseed, Stage measurement at gaging stations, U.S. Geological Survey Techniques and Methods 3-A7, 2010. doi.org/10.3133/tm3A7.
- I. Durre, M. J. Menne, B. E. Gleason, T. G. Houston and R. S. Vose, Comprehensive automated quality assurance of daily surface observations, Journal of Applied Meteorology and Climatology 49 (8), 1615–1633, 2010. doi.org/10.1175/2010JAMC2375.1.
- R. J. Wagner, R. W. Boulger, C. J. Oblinger and B. A. Smith, Guidelines and standard procedures for continuous water-quality monitors: station operation, record computation, and data reporting, U.S. Geological Survey Techniques and Methods 1-D3, 2006. doi.org/10.3133/tm1D3.
- J. S. Horsburgh, S. L. Reeder, A. S. Jones and J. Meline, Open source software for visualization and quality control of continuous hydrologic and water quality sensor data, Environmental Modelling & Software 70, 32–44, 2015. doi.org/10.1016/j.envsoft.2015.04.002.