
How dam spillways and gates work, and why gate operations need real-time data
Spillway and gate types, the design flood, the ogee discharge equation with a worked example, and why every gate decision depends on what the river is doing upstream and downstream.

During a monsoon flood, the engineer in a dam control room faces one recurring question: open the gates further, hold, or close? Release too little and the reservoir climbs towards the top of the dam. Release too much, or too suddenly, and the dam itself sends a flood wave into the villages downstream. The answer depends on three numbers that change by the hour: how much water is arriving, how high the reservoir stands, and how much more the river below can take. This article explains spillways and gates, the hydraulics and design flood behind them, and why those three numbers must be measured in real time.
What a spillway is for
A spillway carries surplus water past a dam safely. The Bureau of Indian Standards (BIS) notes that every artificial storage is a potential hazard downstream, and the spillway exists to reduce that hazard to an acceptable level. Its capacity must be enough to pass a pre-determined inflow design flood without irreparable damage to the spillway or the dam [1].
A few reservoir levels recur throughout this subject:
- Full reservoir level (FRL): the normal top of the storage the reservoir is operated to.
- Maximum water level (MWL): the highest level the reservoir is allowed to reach while passing the design flood.
- Surcharge storage: the volume between FRL and MWL, a buffer that absorbs part of a flood [1].
- Freeboard: the vertical margin between the water level and the top of the dam, which must still be available at both FRL and MWL [1].
Types of spillway
IS 10137 describes the main spillway types and when each is used [2]. Four are shown below; the standard also covers siphon, free-fall, barrage, tunnel, saddle and sluice spillways and fuse plugs.
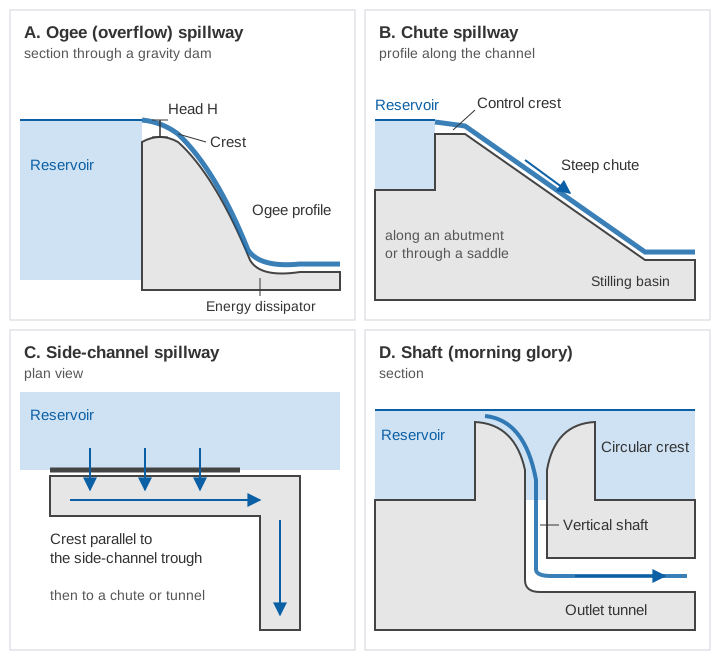
- Ogee (overflow) spillway. The crest is S-shaped, following the underside of the sheet of water that would spring off a sharp-edged weir. It is most commonly used with gravity dams, can serve as the control crest for almost any other type, and has a high discharging efficiency. It may be gated or ungated [2].
- Chute spillway. Water passes a control crest and runs down a steep, excavated or built-up channel to the river, usually along an abutment or through a saddle in the reservoir rim. It is common with earth and rockfill dams [2].
- Side-channel spillway. The crest runs parallel to the discharge channel, so water spills sideways into a trough. It suits steep abutments where a long crest is needed to limit the discharge per metre of crest, but it is hydraulically less efficient [2].
- Shaft (morning glory) spillway. Water spills over a circular crest, drops down a vertical or sloping shaft and leaves through a nearly horizontal tunnel. It suits narrow gorges, but it reaches its full capacity at relatively low heads and cannot pass a flood much larger than its design capacity, so it is used as a service spillway alongside an emergency spillway [2].
Gated or ungated
An ungated (uncontrolled) crest releases water automatically whenever the reservoir rises above it. It needs no operator and no gate maintenance. Gates become necessary when a long enough crest or a large enough surcharge cannot be provided, or when water must be released from below the normal reservoir level [6]. Gates let a dam store water up to their tops and still pass a large flood, but they turn every release into a decision, and every decision needs information.
Types of gate
IS 13623 classifies gates by position (crest gates and submerged gates), by head over the sill and by duty: service gates regulate flow, while emergency and maintenance gates (bulkheads, stoplogs) close an opening when needed [5]. On spillway crests, two types dominate.
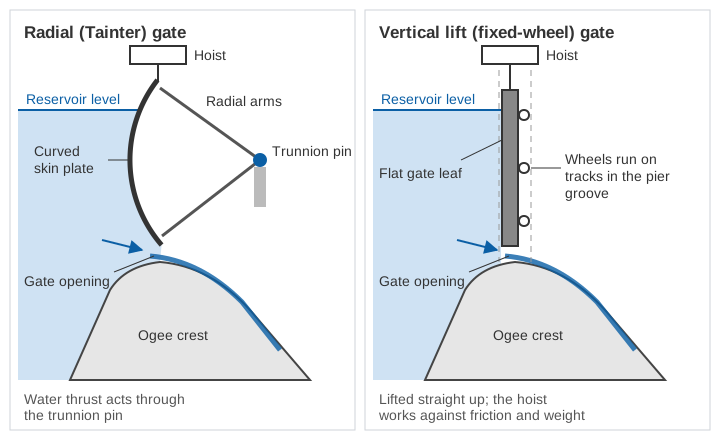
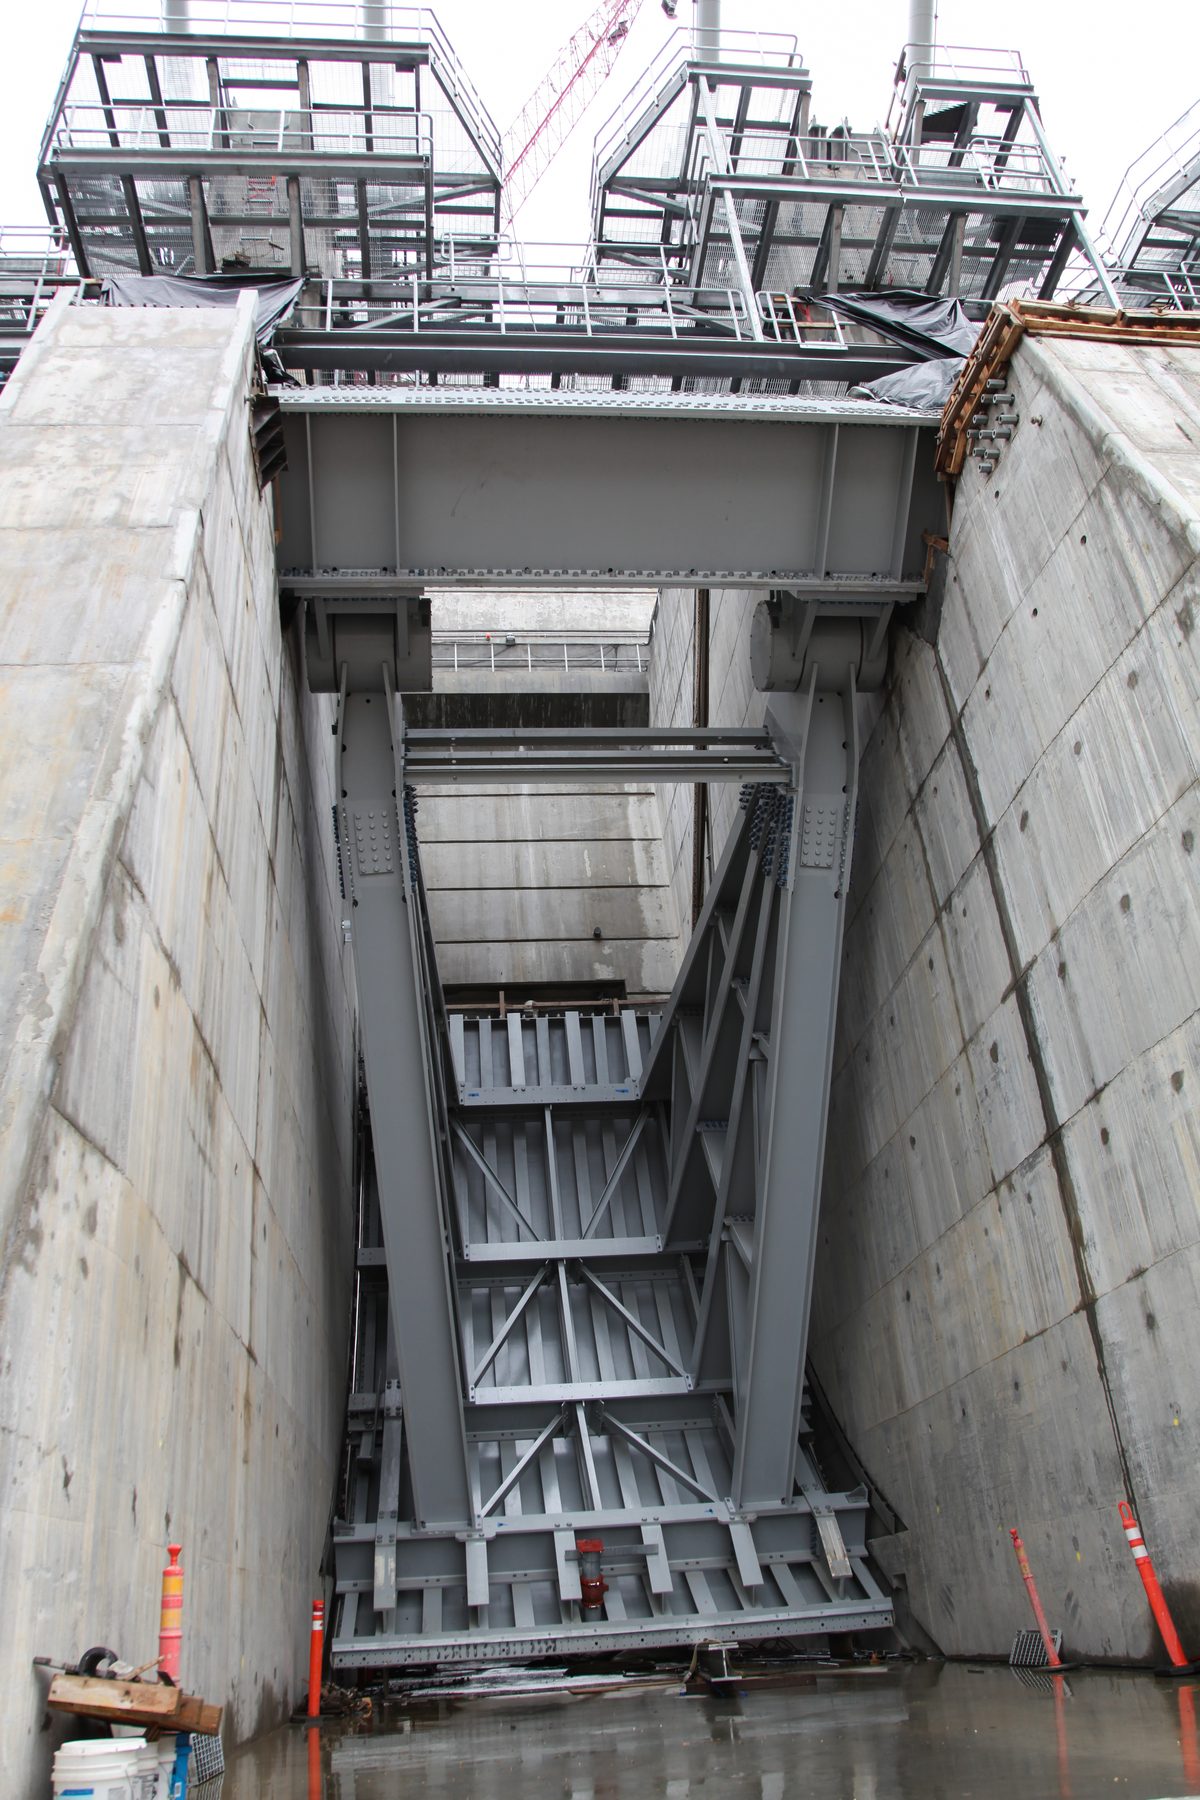
Radial (Tainter) gates. The gate is a segment of a cylinder: a curved steel skin plate, stiffened and carried on radial arms that meet at trunnion pins set into the piers. The arc is centred on the trunnion, so the water load passes through the pins and the hoist only has to overcome part of the gate weight and some friction [4][6]. BIS describes it as generally the economical choice for large crest gates [4], and IS 6934 calls it the most common type on gated spillways [3].
Vertical lift gates. A flat gate leaf moves straight up and down in grooves in the piers. Slide gates bear directly on their seats, so friction limits their size. Fixed-wheel (roller) gates carry the water load through wheels on vertical tracks, which reduces friction and allows larger gates with a smaller hoist [6].
The design flood: how big a flood must the spillway pass?
Spillway capacity is fixed by the inflow design flood (IDF): the flood that the dam must pass safely, without overtopping or structural failure, when it is routed through the reservoir under standard assumptions [1]. IS 11223 links the IDF to the size of the dam, taking the larger class given by gross storage or by static head:
| Dam size | Gross storage | Static head | Inflow design flood for safety of the dam |
|---|---|---|---|
| Small | 0.5 to 10 million m³ | 7.5 to 12 m | 100-year flood |
| Intermediate | 10 to 60 million m³ | 12 to 30 m | Standard project flood (SPF) |
| Large | more than 60 million m³ | more than 30 m | Probable maximum flood (PMF) |
Classification and IDF from IS 11223:1985, clauses 3.1.2 and 3.1.3, with Amendment 2 (1991), which replaced hydraulic head by the static head at FRL [1].
The probable maximum flood comes from the most severe combination of meteorological and hydrological conditions reasonably possible in the region, computed from the probable maximum storm, an estimate of the physical upper limit of precipitation over the basin. The standard project flood uses the most severe combination reasonably characteristic of the region, excluding very rare storms [1]. Hazard can override size: where studies or judgement indicate imminent danger to present or future settlements downstream, the PMF should be used [1].
Three further provisions matter for operations:
- Routing starts with the reservoir already at the top of the conservation pool. Pre-depletion based on forecasts is not credited when the design is checked [1].
- At least 10 % of gates, and a minimum of one, should be assumed inoperative as an emergency condition [1].
- The gate rules used in the design routing must be rules that can actually be followed in practice [1].
In law, the Dam Safety Act, 2021 applies to specified dams: those above 15 m in height, and those between 10 and 15 m that meet further criteria such as a reservoir of at least one million m³ or a maximum flood discharge of at least 2,000 m³/s [8].
How much water does a crest pass?
Free flow over an ogee crest
With the gates fully raised, flow over an ogee crest follows the weir equation used in IS 6934 and the US Bureau of Reclamation's Design of Small Dams [3][6]:
Q  = C · L · H^1.5

Q  = discharge (m³/s)
C  = discharge coefficient; in SI units typically 1.80 to 2.21 (IS 6934)
L  = effective crest length (m)
H  = head on the crest, including the velocity head of approach (m)

Effective length, allowing for contraction at piers and abutments:
L  = L' − 2 · (N · Kp + Ka) · H

L' = net crest length (total clear width of the bays)
N  = number of piers
Kp = pier contraction coefficient (0.02 square-nosed with rounded corners, 0.01 round-nosed, 0 pointed)
Ka = abutment contraction coefficient (0.20 square, 0.10 or 0 rounded, depending on radius and angle)
The coefficient depends on crest shape, approach depth, the ratio of actual head to design head, and submergence by the tailwater. It falls below its design-head value at lower heads and rises above it at higher heads [3].
Worked example (illustrative numbers)
Take a hypothetical gated ogee spillway with 8 bays, each 12 m clear, separated by 7 round-nosed piers, with rounded abutments. So L' = 96 m, N = 7, Kp = 0.01, Ka = 0.10, and we take C = 2.1, inside the range given by IS 6934. For simplicity we hold C constant; a real rating would vary it with head.
At H = 10 m:
L = 96 − 2 × (7 × 0.01 + 0.10) × 10 = 96 − 3.4 = 92.6 m
Q = 2.1 × 92.6 × 10^1.5 = 2.1 × 92.6 × 31.62 ≈ 6,150 m³/s

At H = 5 m:
L = 96 − 2 × 0.17 × 5 = 94.3 m
Q = 2.1 × 94.3 × 11.18 ≈ 2,210 m³/s

At H = 11 m:
L = 96 − 2 × 0.17 × 11 = 92.26 m
Q = 2.1 × 92.26 × 36.48 ≈ 7,070 m³/s
Two things stand out. Halving the head cuts the discharge to about 36 % of the value at 10 m, because of the 1.5 power. And near the top, a 1 m rise (10 %) adds about 15 % more discharge. This is why reservoir level is the single most important number at a gated dam: an error of a few centimetres in head becomes an error of hundreds of cubic metres per second in the computed release. The same issue of converting a measured level into a flow is discussed for rivers in rating curves: from stage to discharge.
Try the relation yourself:
Flow under a partly open gate
When a gate is only partly raised, the water passes beneath it as orifice flow, and the discharge per bay is computed differently [6]:
Q = C · D · L · √(2 g H)

D = shortest distance from the gate lip to the crest curve (the opening)
L = crest width of the bay
H = head to the centre of the gate opening, including velocity head of approach
C = coefficient that depends on gate type, crest shape and the angle of the gate lip
Rating tables giving discharge for each gate opening and reservoir level are built from these relations and hydraulic model studies, and the Central Water Commission (CWC) asks that every dam's operation and maintenance manual include them [7].
Passing a flood without endangering the dam or the valley
A reservoir obeys a simple water balance:
Inflow − Outflow = rate of change of storageWhen inflow exceeds outflow, the reservoir rises. How fast depends on its surface area. An illustrative case: a reservoir with 20 km² of water surface near FRL, receiving 4,000 m³/s while releasing 2,000 m³/s.
Rise rate = (4,000 − 2,000) / 20,000,000 m² = 0.0001 m/s = 0.36 m per hour
If the surcharge between FRL and MWL is 1.5 m: 1.5 / 0.36 ≈ 4.2 hours to use it up
Now the opposite move. To create 0.5 m of space in the same reservoir before a forecast storm:
Volume = 0.5 m × 20,000,000 m² = 10 million m³
At an extra 500 m³/s: 10,000,000 / 500 = 20,000 s ≈ 5.6 hours
The operator therefore needs to know the inflow hours ahead, not after it has arrived. IS 11223 anticipates staged operation: normal-flood rules may restrict outflow or its rate of change, and an emergency schedule allowing unrestricted outflow comes into force only once a flood is recognised as large [1].
The CWC guidelines also set out how the gates themselves are moved [7]:
- Open the end gates first, then the centre gates, then the rest symmetrically, increasing openings gradually.
- Keep the difference in opening between any two adjacent bays within 0.5 m.
- Close in the reverse order, lowering gates in steps of 0.2 to 0.3 m.
These rules protect the gates, the energy dissipator and the channel below, and they mean that large changes in release take time.
Why gate schedules depend on real-time data
A gate schedule is a decision about the future made with information about the present. Three measurements feed it.
- Inflow. From river gauging stations above the reservoir, catchment rainfall and upstream dam releases, which the CWC counts as part of inflow [7]. Inflow forecasts set how early pre-releases can start.
- Reservoir level. It fixes the head on the crest and therefore the discharge through every opening, and it tells the operator how much surcharge remains.
- Downstream river levels. They show how much the channel below can still carry, how far the released water has travelled, and when people need to be warned.
Indian law and guidance ask for all three. The Dam Safety Act, 2021 requires the owner of every specified dam to establish a hydro-meteorological network, an inflow forecasting system and an emergency flood warning system for areas downstream, and to share anticipated inflows and outflows with district authorities and the public [8]. The CWC guidelines ask for a control room watching probable inflows, coordination with upstream and cascading projects, sirens or hooters at least 15 minutes before releases, and releases planned in advance with real-time telemetry data [7]. How such data are collected and transmitted is covered in what is an RTDAS, and how warnings reach people in early warning dissemination.
What goes wrong when releases come late or all at once
IS 11223 states the risk directly: human failures in operating a high-capacity spillway may cause a downstream flood larger than the inflow flood [1]. A reservoir held full leaves no room to absorb a late surge, so the operator must release whatever arrives, just when the rivers below are already high.
Kerala, August 2018
The Kerala floods of August 2018 are a widely studied case of extreme rain on nearly full reservoirs. The role of the dams was debated [10], so we report only what official and peer-reviewed sources state.
- The rain. The CWC's study report, quoted by the Government of Kerala, found that rainfall over the whole state during 15 to 17 August 2018 was 414 mm, against 443 mm during the historic storm of 16 to 18 July 1924, and that these three days generated around 12 billion m³ of runoff [9].
- The reservoirs. Most of the state's reservoirs were near FRL by the end of July 2018 [10]. At Idukki, the measured peak inflow was 2,532 m³/s and the release 1,614 m³/s, on 15 August [10].
- The CWC view. As summarised by Sudheer and colleagues, the CWC's rapid assessment concluded that releases during the extreme rainfall could not have been avoided because most reservoirs were near FRL, and that the releases did not play a role in the extent of flooding [10].
- A modelling study. In the Periyar basin model of Sudheer et al., the nearly uncontrolled Perinjankutty contributed about 3,500 m³/s at the peak, the Idamalayar (release plus free catchment) 2,828 m³/s and the Muthirapuzha 2,037 m³/s, against 1,860 m³/s simulated from Idukki. The model also showed the dams reducing the peak compared with a basin without them [10].
| Scenario at Neeleswaram (Periyar), Sudheer et al. (2019) | Peak discharge |
|---|---|
| Observed peak, August 2018 | 8,800 m³/s |
| Simulated, reservoirs at 85 % of storage at end of July (as occurred) | 9,965 m³/s |
| Simulated, reservoirs drawn down to 75 % by end of July | 8,340 m³/s (16 % lower) |
| Simulated, reservoirs at 50 % or 25 % | 21 % lower |
| Approximate bankfull capacity of the river | 4,200 m³/s |
Source: [10]. Simulated and observed values differ because of rainfall data and model uncertainty, as the authors note.
The authors concluded that earlier drawdown could have reduced the peak but not kept the river within its banks, that rainfall forecasts at long lead times were not reliable enough, and that the rule curves of the reservoirs should be revisited to serve flood control as well as power, supported by better rainfall and inflow forecasts and multi-reservoir operating rules [10]. Whatever view one takes of the operations, the lesson matches the standards: plan releases ahead from measured and forecast inflows, and warn downstream before they happen.
Key points
- The main spillway types are ogee, chute, side-channel and shaft; gates add storage but make every release a decision.
- Radial gates, whose water load passes through the trunnion pins, are the most common crest gates.
- IS 11223 sets the inflow design flood by dam size and hazard: 100-year flood, SPF or PMF.
- Ogee discharge follows Q = C·L·H^1.5, so small errors in reservoir level become large errors in release.
- Safe operation needs real-time inflow, reservoir level and downstream levels, gradual gate movements and advance warning, as the Dam Safety Act, 2021 and CWC guidelines require.
Where ClimMaTech fits
At ClimMaTech we work on the measurement and warning side of reservoir operation: the river, rain and level data that gate decisions depend on, upstream and downstream of the dam. Our approach is described on the dam and reservoir monitoring page.
References
- Bureau of Indian Standards, IS 11223:1985 Guidelines for Fixing Spillway Capacity (reaffirmed 2004, with Amendments 1 and 2), BIS, 1985. law.resource.org (archived copy)
- Bureau of Indian Standards, IS 10137:1982 Guidelines for Selection of Spillways and Energy Dissipators (reaffirmed 2004), BIS, 1982. law.resource.org (archived copy)
- Bureau of Indian Standards, IS 6934:1998 Hydraulic Design of High Ogee Overflow Spillways: Recommendations (first revision), BIS, 1998. law.resource.org (archived copy)
- Bureau of Indian Standards, IS 4623:2000 Recommendations for Structural Design of Radial Gates (third revision), BIS, 2000. law.resource.org (archived copy)
- Bureau of Indian Standards, IS 13623:1993 Criteria for Choice of Gates and Hoists, BIS, 1993. law.resource.org (archived copy)
- U.S. Bureau of Reclamation, Design of Small Dams, third edition, Chapter 9 (Spillways), US Department of the Interior, 1987. usbr.gov
- Central Water Commission, Guidelines for Preparing Operation and Maintenance Manual for Dams, Doc. No. CDSO_GUD_DS_03_v1.0, Central Dam Safety Organisation, January 2018. iitr.ac.in (copy)
- Government of India, The Dam Safety Act, 2021 (No. 41 of 2021), Gazette of India Extraordinary, 14 December 2021. cwc.gov.in
- Government of Kerala, State Relief Commissioner, Additional Memorandum: Kerala Floods 2018, 1st August to 30th August 2018, 13 September 2018. sdma.kerala.gov.in
- K. P. Sudheer, S. M. Bhallamudi, B. Narasimhan, J. Thomas, V. M. Bindhu, V. Vema and C. Kurian, Role of dams on the floods of August 2018 in Periyar River Basin, Kerala, Current Science 116(5), 780–794, 2019. doi:10.18520/cs/v116/i5/780-794