
Normal, excess, deficient: how IMD classifies monsoon rainfall
What the India Meteorological Department means by a normal monsoon, how percentage departures are turned into categories for districts and the country, and why a normal year nationally can still bring floods and drought side by side.

Every monsoon, the same words appear in bulletins, newspapers and district meetings: normal, excess, deficient, large deficient. Each is a category defined by the India Meteorological Department (IMD) with a numerical threshold, and the same word can mean different things for a district and for the country as a whole. A district officer reading "deficient" in a weekly map and a planner reading "deficient monsoon" in a seasonal forecast are looking at two different thresholds.
This article explains what IMD means by "normal", how departures are classified, how the all-India categories differ, and why a normal monsoon for India can still leave one district flooded and its neighbour short of rain.
What "normal" means: the long period average
IMD measures rainfall against a normal, the average rainfall for the same place and the same period (a day, week, month, season or year) over a long run of years. For the southwest monsoon season over the whole country, this average is called the Long Period Average (LPA).
Normals are not fixed for ever. IMD prepares them from 50 years of data and updates them once every decade with the latest raingauge records [1]. In April 2022 IMD announced new normals based on 1971–2020, replacing those based on 1961–2010, with effect from the 2022 southwest monsoon season [1]. The key numbers from that release are:
| Quantity (all-India) | 1961–2010 normal | 1971–2020 normal |
|---|---|---|
| Southwest monsoon season, June–September | 880.6 mm | 868.6 mm |
| Annual rainfall | 1,176.9 mm | 1,160.1 mm |
| June | 166.9 mm | 165.4 mm |
| July | 285.4 mm | 280.4 mm |
| August | 258.1 mm | 254.9 mm |
| September | 170.2 mm | 167.9 mm |
The seasonal LPA of 868.6 mm is the figure IMD quotes, rounded, as "87 cm" in its forecasts [2]. The monsoon season brings about 75 % of India's annual rainfall [1]. IMD attributed the 12.0 mm decrease in the seasonal normal to natural multidecadal variability [1].
The new normals were computed from 4,132 raingauge stations representing 703 districts [1]. That is, on average, about six gauges per district (4,132 ÷ 703 ≈ 5.9), a number worth remembering when we come to hill districts below.
Two consequences follow for anyone using IMD data:
- A departure is always relative to a specific normal. When you compare reports from before and after 2022, check which normal each used.
- Every place and every period has its own normal. The normal for Mandi district in the week of 15 July is not the same as the normal for Mandi in September or for Kinnaur in July. All categories below are computed against the normal for that exact place and period.
The basic calculation: percentage departure
For any area and period, IMD reports the actual rainfall, the normal rainfall and the percentage departure (written "% DEP." in its tables) [3]:
Percentage departure = (Actual − Normal) / Normal × 100A positive departure means more rain than normal; a negative departure means less. A departure of −100 % means no rain at all. IMD's tables show departures as whole percentages [3].
The departure categories for districts, states and subdivisions
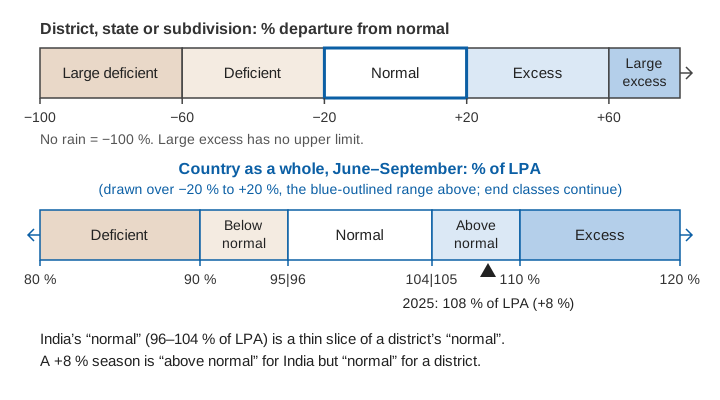
IMD converts the percentage departure into one of six categories. IMD uses this scheme in its rainfall reports for districts, states and meteorological subdivisions, both for single days and for cumulative periods such as the season to date [3][4]. The thresholds below are taken directly from the legend of IMD's district rainfall distribution report [3]:
| Category | Abbreviation | Percentage departure from normal |
|---|---|---|
| Large excess | LE | +60 % or more |
| Excess | E | +20 % to +59 % |
| Normal | N | −19 % to +19 % |
| Deficient | D | −20 % to −59 % |
| Large deficient | LD | −60 % to −99 % |
| No rain | NR | −100 % |
| Data not available | ND | — |
Two things to notice:
- The normal band is wide: ±19 %. A district can receive 18 % less rain than usual and still be classed "normal".
- Short periods and dry seasons give extreme numbers. When the normal is small, a few millimetres of rain produce a very large percentage. A week with a normal of 4 mm and an actual of 10 mm is +150 %, "large excess", even though the rain is hydrologically trivial. Departures from daily and weekly totals, and from dry-season months, should be read with the absolute amounts beside them.
Try the calculation yourself. Enter an actual and a normal rainfall total, and choose the scale:
The all-India seasonal categories: a different scale
When IMD forecasts or summarises the monsoon for the country as a whole, it uses a second, much narrower scheme, expressed as a percentage of the LPA rather than as a departure. These five categories, with the climatological probability of each (how often each has occurred historically), are published in IMD's long-range forecast press releases [2]:
| All-India seasonal category | Rainfall as % of LPA | Equivalent departure | Climatological probability |
|---|---|---|---|
| Deficient | less than 90 % | below −10 % | 16 % |
| Below normal | 90–95 % | −10 % to −5 % | 17 % |
| Normal | 96–104 % | −4 % to +4 % | 33 % |
| Above normal | 105–110 % | +5 % to +10 % | 16 % |
| Excess | more than 110 % | above +10 % | 17 % |
The country-wide normal band is only ±4 %, far narrower than the ±19 % used for a district, because averaging over the whole country cancels much of the local variability: a dry northeast and a wet northwest partly offset each other. The bands are set so that each category has a sensible historical frequency, roughly one year in three for normal and one in six for each of the others [2].
The practical consequence is that the same word carries different thresholds. A "deficient" monsoon for India means less than 90 % of the LPA, a shortfall of more than 10 %. A "deficient" district means a shortfall of 20–59 %. Neither is wrong; they are different scales for different areas.
Deficient is not the same as drought
"Drought" has its own, older definitions in IMD's research literature. In a study of drought climatology in Mausam, IMD scientists treated a subdivision as being in meteorological drought when its June–September rainfall departure was −25 % or worse, classified as moderate for departures between −26 % and −50 % and severe below −50 % [6]. Noting that there was no agreed criterion for calling a whole year a drought year for the country, they tested area-based rules: a year counted as a drought year when the area affected exceeded 20 % (or, in a second version, 25 %) of the country [6]. The −25 % drought threshold falls inside today's "deficient" band (−20 % to −59 %), so a deficient district is not necessarily in meteorological drought on that definition, and drought also depends on soil moisture, crops and water stores, which a rainfall category does not capture.
Regional and monthly forecasts use terciles
For the four broad homogeneous regions (northwest India, central India, south peninsula and northeast India), the monsoon core zone, and for individual months, IMD's forecasts use three tercile categories: below normal, normal and above normal, each with a climatological probability of one third [2]. Because rainfall variability differs by region and month, the limits differ too. In the 2025 forecasts, for example, the normal band was 94–106 % of LPA for northeast India and the monsoon core zone, but 92–108 % for northwest India [2], and the end-of-season review describes June 2025 rainfall as above normal when above 108 % of LPA and July as normal between 94 % and 106 % [4]. When you read a regional or monthly forecast, take the thresholds from that forecast, not from the tables above.
How the scales apply: country, subdivision, district
IMD monitors daily, weekly, monthly, seasonal and annual rainfall for districts, states, meteorological subdivisions, homogeneous regions and India as a whole, in real time [1]. The hierarchy matters for interpretation:
- District. The smallest unit for which IMD routinely publishes rainfall and categories, and the one most relevant to local response.
- Meteorological subdivision. IMD divides India into 36 meteorological subdivisions [1]. End-of-season summaries report how many subdivisions fell into each departure category and what fraction of the country's area they cover [4].
- Homogeneous region. Northwest, central, east and northeast, and south peninsular India, used for regional forecasts [2].
- Country as a whole. The headline figure, classified on the five-category LPA scale.
How are the levels connected? IMD scientists have documented the method used to build the department's long homogeneous rainfall series: district rainfall is the arithmetic average of the stations in the district, subdivision rainfall is the area-weighted average of its districts, and all-India rainfall is the area-weighted average of the 36 subdivisions [5]. Area weighting means a large subdivision counts for more than a small one, whatever its rainfall, so the national figure describes the rain over the country's area, not the experience of its average district.
A worked example for one district
The numbers below are illustrative, chosen to show the arithmetic; they are not observations from any particular district.
Step 1: cumulative rainfall from 1 June to 15 July. Normal 380 mm, actual 300 mm.
Departure = (300 − 380) / 380 × 100 = −21.1 % → −21 % → Deficient (D)Step 2: the week of 16–22 July. Normal for the week 95 mm. Two days of very heavy rain bring 260 mm.
Departure for the week = (260 − 95) / 95 × 100 = +173.7 % → +174 % → Large excess (LE)Step 3: cumulative rainfall from 1 June to 22 July. Normal 380 + 95 = 475 mm; actual 300 + 260 = 560 mm.
Departure = (560 − 475) / 475 × 100 = +17.9 % → +18 % → Normal (N)Step 4: the whole season, 1 June to 30 September. Normal 1,250 mm, actual 1,400 mm.
Departure = (1400 − 1250) / 1250 × 100 = +12 % → Normal (N)The seasonal category hides the story. The district was in deficit for six weeks, then received a week of large-excess rain that may well have caused landslides and flash floods, and ended the season "normal". Flood and landslide work needs the short-period numbers; water resources and agriculture need the cumulative ones.
Now compare the national scale. In 2025, India received 937.2 mm against the LPA of 868.6 mm [4]:
937.2 / 868.6 × 100 = 107.9 % → 108 % of LPA → departure +8 %On the all-India scale this is above normal (105–110 % of LPA), as IMD reported [4]. The same +8 % departure in a district would simply be normal.
Why a normal monsoon can mean flood here and drought there
The all-India figure summarises very uneven rain. IMD's end-of-season statements for the four seasons since the 1971–2020 normal came into use show how wide the regional spread is, year after year [4][7][8][9]:
In 2025, an above-normal national season, 3 of the 36 subdivisions (Arunachal Pradesh, Assam & Meghalaya, and Bihar) were deficient, and IMD reported that rainfall over east and northeast India was the second lowest since 1901 while northwest India had its highest since 2001 [4]. Months vary as much as places: 2023 ended at 94 % of LPA, but August that year received only 64 % [8].
Several reasons explain why the national category says little about any one district:
- The district bands are wide. A district can lose almost a fifth of its normal rain and remain "normal". For a farmer or a reservoir operator, a 15–19 % shortfall can still matter.
- Seasonal totals hide timing. As the worked example shows, a long dry spell followed by a burst of extreme rain can sum to a normal season. Floods and landslides respond to hours and days of rain, not to seasonal totals.
- Gauge density limits what a district value can represent. With on average about six gauges per district behind the normals [1], and steep rainfall gradients across ridges and valleys in the Himalaya, a district average can miss a cloudburst over one catchment entirely. See monitoring rivers in hill and Himalayan catchments for why this matters in the mountains.
Using IMD categories well
For engineers, district officials and researchers, a few habits help:
- Always look at the actual and normal in millimetres, not only the category. A large-excess week with 10 mm of rain is not a flood signal.
- Use the period that matches the hazard. Daily and weekly departures for floods and landslides, cumulative seasonal departures for water resources, agriculture and drought.
- For local decisions, add local measurements. A well-sited gauge in your own catchment, maintained and checked, fills the gap between district averages and the rain that actually reaches a slope or a stream. See tipping-bucket rain gauge errors, siting and calibration for what makes such a record trustworthy, and flash floods versus river floods for why rainfall intensity, not seasonal totals, sets the warning time.
Key points
- IMD's "normal" is the average for the same place and period over 50 years, updated every decade; since 2022 it is based on 1971–2020, giving an all-India monsoon LPA of 868.6 mm (about 87 cm).
- Percentage departure = (actual − normal) / normal × 100.
- For districts, states and subdivisions: large excess ≥ +60 %, excess +20 to +59 %, normal −19 to +19 %, deficient −20 to −59 %, large deficient −60 to −99 %, no rain −100 %.
- For India as a whole: deficient < 90 % of LPA, below normal 90–95 %, normal 96–104 %, above normal 105–110 %, excess > 110 %.
- Regional and monthly forecasts use tercile categories with limits that vary by region and month.
- A normal or above-normal national monsoon can include deficient regions and extreme local rainfall, as 2025 showed.
At ClimMaTech we build monitoring for the scale where these averages stop being enough: the individual catchment, slope and river reach. Our VARSHAQ weather station, now in development, is designed to record rainfall and other variables at the site where a decision is taken, so that a local record can be read alongside IMD's district and subdivision figures rather than in place of them.
References
- India Meteorological Department, Updated Rainfall Normal based on data of 1971-2020 (press release), Ministry of Earth Sciences, New Delhi, 14 April 2022. internal.imd.gov.in
- India Meteorological Department, Updated Long Range Forecast for the Southwest Monsoon Seasonal Rainfall during June–September, 2025 and Monthly Rainfall and Temperature Outlook for June 2025 (press release), Ministry of Earth Sciences, New Delhi, 27 May 2025. internal.imd.gov.in
- India Meteorological Department, Hydromet Division, District Rainfall Distribution (daily report, with category legend), New Delhi, updated daily. mausam.imd.gov.in
- India Meteorological Department, Salient Features of the 2025 Southwest Monsoon Season, Ministry of Earth Sciences, New Delhi, 30 September 2025. mausam.imd.gov.in
- P. Guhathakurta, M. Rajeevan, Trends in the rainfall pattern over India, International Journal of Climatology 28 (2008), 1453–1469. doi:10.1002/joc.1640
- A. Chowdhury, V. P. Abhyankar, On some climatological aspects of drought in India, Mausam 35(3) (1984), 375–378. doi:10.54302/mausam.v35i3.2209
- India Meteorological Department, Salient Features of Monsoon 2022 (press release), Ministry of Earth Sciences, New Delhi, 1 October 2022. internal.imd.gov.in
- India Meteorological Department, End of Season Report: Southwest Monsoon 2023, Ministry of Earth Sciences, New Delhi, 30 September 2023. internal.imd.gov.in
- India Meteorological Department, Salient Features of the 2024 Southwest Monsoon Season, Ministry of Earth Sciences, New Delhi, 1 October 2024. internal.imd.gov.in