
Accuracy, resolution, precision: reading a sensor datasheet
What the words and the ±x on a datasheet actually promise, why resolution is not accuracy, and how to put two sensors on the same footing before you choose one.

Two water-level sensors arrive on your desk for a tender evaluation. One datasheet says "accuracy ±0.05 % FS". The other says "±5 mm". The first looks more impressive: five hundredths of a percent sounds tiny. Which one will give you the better record at a river station where the water usually sits around 2 m?
You cannot tell from the headlines. One is a percentage of the full range, the other an absolute value; one may be a maximum and the other a typical figure; and both were measured under conditions unlike a riverbank in May or a hill station in January. This article explains what datasheet terms mean, using the international definitions, and shows how to put two specifications in the same terms at your operating point.
The vocabulary, from the official definitions
The words below have agreed meanings. The reference is the International Vocabulary of Metrology (the VIM, JCGM 200:2012) [1], together with ISO 5725-1 for trueness and precision [2] and the WMO Guide to Instruments and Methods of Observation (WMO-No. 8), which takes its definitions of instrument characteristics from the VIM [4].
Accuracy, trueness and precision
Measurement accuracy is the "closeness of agreement between a measured quantity value and a true quantity value of a measurand" (the measurand is the quantity you intend to measure, here the water level) [1]. The VIM adds a note that matters for every datasheet: accuracy "is not a quantity and is not given a numerical quantity value" [1]. The WMO Guide follows the same practice: accuracy is qualitative, and the old habit of writing "an accuracy of ±x" should read "an uncertainty of x" [4].
Accuracy has two parts, which is why ISO 5725 is titled Accuracy (trueness and precision) of measurement methods and results [2]:
- Trueness is the closeness of agreement between the average of an infinite number of repeated readings and a reference value [1]. It is the opposite of systematic error, or bias: an offset that is the same, or changes slowly, from one reading to the next.
- Precision is the closeness of agreement between repeated readings of the same or similar objects under specified conditions [1]. It is usually expressed as a standard deviation, and it describes random error only. The VIM warns that precision is sometimes "erroneously" used to mean accuracy [1].
ISO 5725-1 puts it in plain words: trueness is the ability of a method to give a true result, precision its ability to replicate a given result [2].
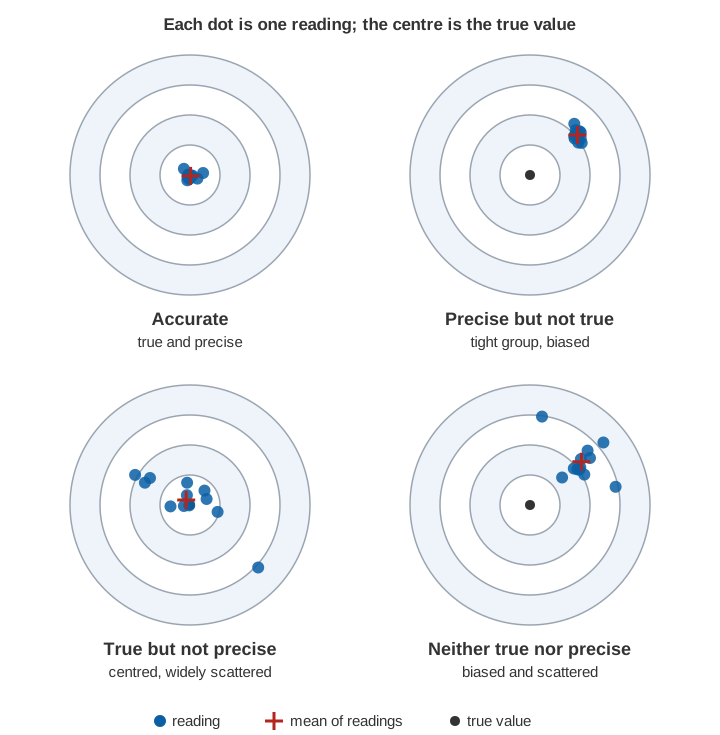
A sensor can be very precise and still wrong. A level sensor mounted 12 mm lower than the survey assumed will repeat beautifully, and every reading will be 12 mm out.
Repeatability and reproducibility
- Repeatability is precision under repeatability conditions: the same procedure, operators, measuring system, operating conditions and location, with repeated measurements over a short period [1].
- Reproducibility is precision under reproducibility conditions, which include different locations, operators and measuring systems [1]. The VIM notes that a specification should say which conditions were changed and which were held constant [1].
A datasheet's "repeatability" is therefore the best case: one unit, on one bench, over minutes. It says nothing about two units of the same model, or the same unit next year.
Resolution
Resolution is the "smallest change in a quantity being measured that causes a perceptible change in the corresponding indication" [1]. The VIM notes that it can depend on noise and friction and can vary with the value being measured [1]. An output with 0.1 mm steps can still have a coarser real resolution if the reading is noisy.
Linearity and hysteresis
Linearity is not defined in the VIM, but the WMO Guide lists non-linearity among the sources of error in a field instrument, alongside drift, repeatability and reproducibility [4].
- Linearity describes how closely the sensor's response follows a straight line between input and output. A non-linearity figure is the largest departure from a reference line, so check which line (through the end points, or best fit): the same sensor gives different numbers for each.
- Hysteresis is "the property of a measuring instrument whereby its response to a given stimulus depends on the sequence of preceding stimuli" [4]. For a level sensor, this means the reading at 2.000 m on a rising stage can differ from the reading at 2.000 m on a falling stage. The GUM notes that where the direction of approach cannot be seen, hysteresis adds an uncertainty that it treats like a resolution step [3].
Drift and stability
Instrumental drift is a "continuous or incremental change over time in indication, due to changes in metrological properties of a measuring instrument" [1]. Stability is the property of keeping those metrological properties constant in time, and the VIM gives two ways to state it: the time over which a property changes by a stated amount, or the change over a stated time [1]. "±0.02 % FS per year" is the second form. Drift is why a sensor needs periodic checks against a reference such as a staff gauge.
Range and the conditions behind the numbers
The measuring interval (commonly called the measuring range) is the set of values that an instrument can measure with a specified uncertainty, under defined conditions [1]. Two kinds of conditions matter:
- Reference operating conditions are the conditions prescribed for evaluating an instrument's performance [1]. The VIM notes that, in IEC usage, these are the conditions under which the specified uncertainty is the smallest possible [1]. In other words, the headline figure is normally the best case.
- Rated operating conditions are the conditions that must be met for the instrument to perform as designed, usually stated as ranges of the measured quantity and of influence quantities such as temperature [1].
When a datasheet gives one accuracy figure "at 20 °C" and an operating temperature range of −20 to +60 °C, the figure belongs to the first, and your station lives in the second.
What "±x" on a datasheet can mean
The same symbol can hide very different promises. Four questions decide what it means.
1. A percentage of what?
- % FS (full scale) or % of range: a fixed amount in millimetres, the same at every level. On a 0–20 m sensor, ±0.05 % FS is ±10 mm everywhere, including at 0.5 m.
- % of reading: grows with the level. ±0.2 % of reading is ±2 mm at 1 m and ±20 mm at 10 m.
- Absolute: a fixed value such as ±5 mm.
- A combination: the GUM gives a real example of this form, a voltmeter specified as "14 × 10⁻⁶ times the reading plus 2 × 10⁻⁶ times the range", valid "between one and two years after the instrument is calibrated" [3]. Note that the time since calibration is part of the specification.
2. Typical or maximum? A maximum (the VIM's maximum permissible error, the extreme error allowed by a specification [1]) is a limit every unit should meet. A typical value describes an average unit, and unless the datasheet defines "typical", you do not know how many units do worse.
3. At what coverage? The VIM and the GUM define an expanded uncertainty as a standard uncertainty multiplied by a coverage factor k [1][3]. For an approximately normal distribution, k = 2 gives an interval with a level of confidence of about 95 % and k = 3 about 99 % [3]. The WMO Guide recommends the 95 % level (k = 2) for all types of measurement [4]. A "±5 mm" that is one standard deviation is twice as wide at 95 % as a "±5 mm" stated at k = 2.
4. Under which conditions? Temperature, supply voltage, target surface, time since calibration and installation all change the result. Assume a figure without stated conditions applies only at reference conditions.
Resolution is not accuracy
A display that shows 2.3471 m invites trust, but resolution tells you how finely a change can be shown, not whether the reading is right.
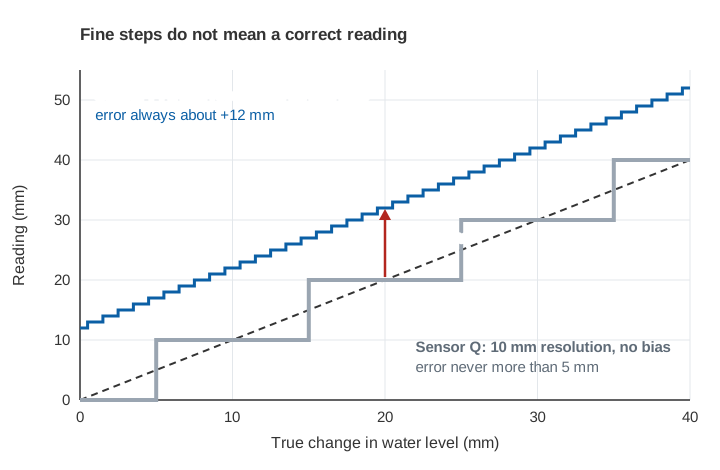
If the reading is quantised in steps of size r and nothing else is known, the GUM treats the true value as equally likely anywhere within ±r/2 of the reading, which gives a standard uncertainty of 0.29 r [3]. For a 1 mm step that is 0.29 mm, which is usually small next to bias, temperature effects and drift. Fine resolution helps you see the start of a rise, but it is rarely the term that decides accuracy.
Comparing two datasheets fairly
- Fix the operating point: the level, temperature range and time since calibration that matter at your site.
- Convert every term to absolute units (millimetres) at that point.
- Convert every term to a standard uncertainty. A limit of ±a, with nothing known about where within it the error lies, becomes a/√3 (the rectangular distribution in the GUM [3]). A term given as one standard deviation is used as is. A term stated at k = 2 is halved.
- Combine independent terms as the root of the sum of squares, then multiply by k = 2 for a 95 % figure [3].
u_c = √( u₁² + u₂² + u₃² + … )       combined standard uncertainty
U   = k · u_c,  with k = 2            expanded uncertainty, about 95 %
limit ±a  →  u = a / √3               rectangular distribution
Adding the limits directly gives a worst case, worth knowing but pessimistic, since all the worst cases rarely coincide. Quadrature addition is only valid for independent terms; a temperature effect and a drift that share a cause are not independent. The method behind these steps is explained more fully in measurement uncertainty for water data.
Worked examples with a water-level sensor
These examples are illustrative. The two datasheets are invented to show the arithmetic, not taken from real products.
| Sensor A | Sensor B | |
|---|---|---|
| Range | 0–20 m | 0–20 m |
| Headline accuracy | ±0.05 % FS, maximum, at 20 °C | ±5 mm, typical (one standard deviation), over −20 to +60 °C |
| Temperature coefficient | ±0.002 % FS per °C | included in headline |
| Long-term stability | ±0.02 % FS per year | ±2 mm per year |
| Resolution | 1 mm | 0.1 mm |
Example 1: % FS against an absolute value, at 2 m and at 10 m
Sensor A's headline is a percentage of full scale, so convert it to millimetres first:
Sensor A:  0.05 % × 20,000 mm = ±10 mm  (at every level)
Sensor B:  ±5 mm                        (at every level)

As a percentage of the reading:
At 2 m:   A  10 / 2,000  = 0.50 %     B  5 / 2,000  = 0.25 %
At 10 m:  A  10 / 10,000 = 0.10 %     B  5 / 10,000 = 0.05 %
The "0.05 %" in A's headline is not 0.05 % of anything you will measure. At a typical 2 m stage it is 0.5 % of the reading. A % FS figure looks best on a sensor with a large range, which is exactly when it hurts most at low water.
Example 2: % FS against % of reading, across the range
Now compare Sensor A with a third illustrative sensor, C, specified as ±0.2 % of reading. At 5 m both give ±10 mm. Below 5 m, C is better; above it, A is better.
Which is better depends on the levels that matter. For flood warning at a site with a 6 m danger level, the error near 6 m counts more than at 1 m; for low-flow monitoring, the reverse. A pure % of reading figure also looks impossibly good near zero; read the small print for a minimum value.
Example 3: adding temperature and drift
Sensor A's ±10 mm holds at 20 °C. Suppose the electronics at your station see 0 to 50 °C over the year (an illustrative assumption; measure your own enclosure). The largest departure from 20 °C is 30 °C.
Temperature:  0.002 % × 20,000 mm = 0.4 mm per °C
              0.4 mm/°C × 30 °C   = ±12 mm
Drift, one year after calibration:
              0.02 % × 20,000 mm  = ±4 mm
Resolution:   1 mm step           = ±0.5 mm

Worst case (all limits added):  10 + 12 + 4 + 0.5 = ±26.5 mm
The temperature term alone is larger than the headline figure.
Example 4: both sensors in the same terms
Treat each of A's limits as rectangular and divide by √3. Sensor B's headline is already one standard deviation, and it already covers temperature.
Sensor A
  u = √( (10/√3)² + (12/√3)² + (4/√3)² + (0.5/√3)² )
    = √( 5.77² + 6.93² + 2.31² + 0.29² ) = 9.3 mm
  U (k = 2) = 18.6 mm

Sensor B
  u = √( 5² + (2/√3)² + (0.05/√3)² ) = √( 25 + 1.33 ) = 5.1 mm
U (k = 2) = 10.3 mm| At the operating point (0–50 °C, one year after calibration) | Sensor A | Sensor B |
|---|---|---|
| Expanded uncertainty, 95 % (k = 2) | ±18.6 mm | ±10.3 mm |
| As % of reading at 2 m | 0.93 % | 0.51 % |
| As % of reading at 10 m | 0.19 % | 0.10 % |
Two lessons follow. The sensor with the smaller-looking headline has the larger uncertainty at the site. And the result hinges on how "±5 mm" is defined: had it been a 95 % figure, B's expanded uncertainty would be about half of what is shown; had "typical" been undefined, you could not compute it at all. When a datasheet does not say, ask. For more on carrying uncertainty through a water record, see measurement uncertainty for water data in plain language.
No datasheet covers the mounting, the survey of the sensor's zero to the gauge datum, or the water surface itself. A 1 cm error in the reference level is in every reading, whatever the sensor.
Try it: convert a specification at your level
A datasheet-reading checklist
Before comparing sensors, answer these for every datasheet:
- Basis. Is the figure % FS, % of reading, absolute, or a combination? What full scale?
- Statistic. Is it a maximum, a typical value, or a stated coverage (for example k = 2, 95 %)? If "typical", how is it defined?
- What is included. Does the headline include non-linearity, hysteresis and repeatability, or are they listed separately?
- Reference conditions. At what temperature (and other conditions) was the figure measured?
- Rated operating conditions. What is the temperature coefficient, and over what range is the sensor specified?
- Stability. How much drift per year, and how often is a check or recalibration recommended?
- Range. Over what range does the stated accuracy apply, and what happens near its ends?
- Resolution versus noise. Is the stated resolution a real, noise-limited figure or just the number of digits in the output?
- Test method. Was the figure measured against a traceable reference, over the whole range, rising and falling?
- Your site. What does the installation add: datum survey, mounting, the water surface, waves, foam or debris?
For water-level instruments, ISO 4373 sets out functional requirements for instruments that measure stage, contact and non-contact, and its Annex A gives guidance on automatic devices and their associated uncertainty [5], which makes it a useful reference for a tender specification. See also radar, ultrasonic, float and pressure sensors compared and how to choose a river water-level sensor.
Key points
- Accuracy is a quality, not a number. It has two parts: trueness (no bias) and precision (little scatter). What a datasheet calls "accuracy ±x" is really an uncertainty or an error limit.
- Resolution is the smallest visible change, not the size of the error. A sensor can resolve 0.1 mm and be wrong by a centimetre.
- "±x" needs four qualifiers: of what (% FS, % of reading, absolute), which statistic (maximum or typical), what coverage (k), and under which conditions.
- Compare sensors at your operating point: convert everything to millimetres, then to standard uncertainties, combine, and state the result at 95 %.
- Temperature effects and drift can be larger than the headline figure. So can the installation.
Where ClimMaTech fits
We ask these same questions of the components that go into our monitoring stations, and we state our own figures with their conditions: Tarang, our radar water-level sensor and AWLR (automatic water level recorder), is specified at ±1 mm under ideal conditions. If you are comparing water-level sensors for a site, we are glad to go through the arithmetic with you.
References
- Joint Committee for Guides in Metrology, International vocabulary of metrology – Basic and general concepts and associated terms (VIM), JCGM 200:2012, 3rd edition, BIPM, 2012. Entries 2.13–2.15, 2.20–2.25, 2.35, 2.38, 4.7, 4.9, 4.11, 4.14, 4.19, 4.21, 4.26. bipm.org PDF; online version at jcgm.bipm.org/vim.
- International Organization for Standardization, ISO 5725-1:2023 Accuracy (trueness and precision) of measurement methods and results – Part 1: General principles and definitions, ISO, 2023. iso.org.
- Joint Committee for Guides in Metrology, Evaluation of measurement data – Guide to the expression of uncertainty in measurement (GUM), JCGM 100:2008, BIPM, 2008. Clauses 4.3.7, 6.3.3, F.2.2.1 and F.2.2.2. bipm.org PDF.
- World Meteorological Organization, Guide to Instruments and Methods of Observation, Volume I: Measurement of Meteorological Variables, Chapter 1 "General", sections 1.6.1–1.6.4, WMO-No. 8, 2024 edition. WMO publication page.
- International Organization for Standardization, ISO 4373:2022 Hydrometry – Water level measuring devices, ISO, 2022. iso.org.