
From sensor to screen: how hydromet data reaches a dashboard
Following one river-level reading from the sensor, through the logger, modem and network, to a server and a dashboard, and adding up the delay at each step.

A flood dashboard shows a number: river level 2.437 m at 10:15. Behind it sits a chain of eight steps across a riverbank, a mobile network and a server, and each can delay, change, duplicate or lose the reading. When the dashboard is used to warn people downstream, it matters which of those happened and how long it took.
This article follows one reading end to end, in terms that apply to any real-time hydromet station. For the wider picture of what such a system is, see what is an RTDAS.
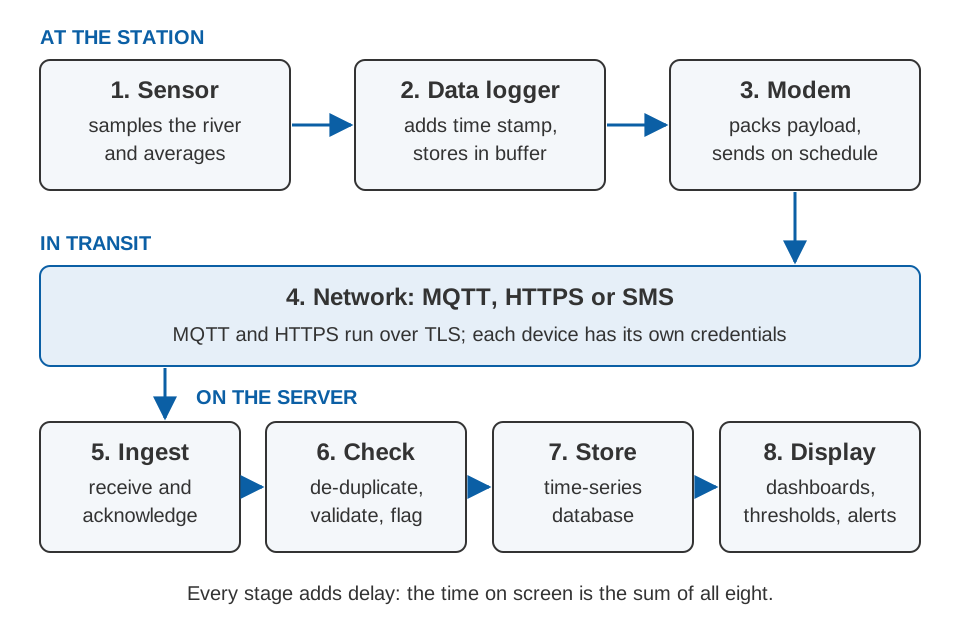
1. The sensor samples and averages
A sensor does not report the river continuously. It takes samples, individual measurements at a fixed rate, and usually combines a burst of them into one value by averaging over a set window. A water-level sensor might take one sample per second and report the mean over 60 seconds. Averaging suppresses waves, ripples and electrical noise, which is why it is used, but it has a cost: after a sudden change in level, a running mean over a window of length A takes about A/2 to reach the midpoint of the change.
Do not confuse the averaging window with the logging interval, how often a value is kept (for example every 5 minutes). The logging interval sets the time resolution of the record, not, by itself, how quickly anyone sees the value.
2. The logger adds a time stamp and stores it
The data logger is the small computer at the station that reads the sensor, attaches a time stamp and writes the value to memory. The time stamp should record when the river had that level, not when the value happened to reach the server. The OGC SensorThings API, an open standard for sensor data on the web, makes this distinction explicit: an observation has a phenomenonTime, "the time instant or period of when the Observation happens", and a separate resultTime, when the result was generated [4]. The standard also notes that if a device sends no time, the service assigns the current server time [4]. For a reading delivered an hour late, that would quietly move it by an hour.
So the logger's clock matters, and so does the time zone written into the stamp. Both are covered in time stamps you can trust.
3. Packaging the reading
Before it is sent, the reading is packed into a payload, the bytes that carry the data. The choice of format decides how many bytes each reading costs, which matters on metered SIM plans, on slow links and when hours of backlog must be sent after an outage.
JSON is a text format that people can read directly. Our illustrative reading, written without spaces:
{"station_id":"STN-042","timestamp":"2025-07-14T10:15:00+05:30","water_level_m":2.437,"battery_v":12.61,"quality_flag":0}That is 121 bytes. Most of them are field names and the written-out time.
Compact binary formats pack numbers as numbers. CBOR (Concise Binary Object Representation) is an IETF standard whose design goals include "extremely small code size, fairly small message size" [7]. A fixed binary layout goes further, if both ends agree on it in advance. For example:
station number  2 bytes  (42)
time            4 bytes  (seconds since 1 Jan 1970 UTC: 1752468300)
level           2 bytes  (millimetres: 2437)
battery         2 bytes  (millivolts: 12610)
quality flag    1 byte   (0)
total          11 bytes
Storing level as whole millimetres and battery as millivolts keeps the same precision as the JSON version.
The difference grows with backlog. Twelve 5-minute readings (one hour) as a compact JSON array take 1,465 bytes. The same hour in a fixed binary block (station number, start time, interval, count, twelve 5-byte readings and a 2-byte checksum) takes 71 bytes.
Binary has costs. A fixed layout cannot be read without its description, changes must reach every station and the server together, and one shifted byte corrupts everything after it. Put a format version number and a checksum in every message. Where bandwidth allows, readable JSON saves debugging time.
4. Getting it off the riverbank
The physical link, whether GSM/4G, LoRa or satellite, is covered in telemetry link design. On top of the link sits a protocol, the agreed set of rules for sending and confirming messages. Three are common for hydromet stations:
- MQTT, a publish-subscribe protocol standardised by OASIS. The station publishes each reading to a named topic, such as
stn/042/wl, on a server called a broker, over a connection that stays open. At quality of service (QoS) 1 the broker confirms every message and the station resends anything unconfirmed, so messages "are assured to arrive but duplicates can occur" [1]. This is the usual main channel for a warning station. WMO's information system, WIS 2.0, which entered its operational phase on 1 January 2025, also uses MQTT to announce new data [5]. - HTTPS, the protocol web browsers use, encrypted with TLS. It is simple and passes almost any firewall, and suits batch uploads, but a POST repeated after a timeout can create duplicates unless the server is built to accept repeats [2].
- SMS, which works where mobile data does not. A message carries only "up to 140 octets" [6] and gives no reliable confirmation to the logger, so SMS suits alarms and a fallback rather than the main channel.
How each protocol works, what it costs in bytes and power, and which to choose for a given station are compared in MQTT, HTTP or SMS: how a field device should report its data. For the rest of this chain, two consequences matter whatever the protocol: a reading can arrive more than once, and it can arrive late.
When the network drops: store and forward
Networks in the hills fail, often during the storm that makes the data valuable. A well-designed station uses store and forward: every reading goes into non-volatile memory first, transmission works through that queue, and a reading is marked as sent only when the server confirms it. When the link returns, the logger sends the backlog, a process called backfilling, oldest first or newest first.
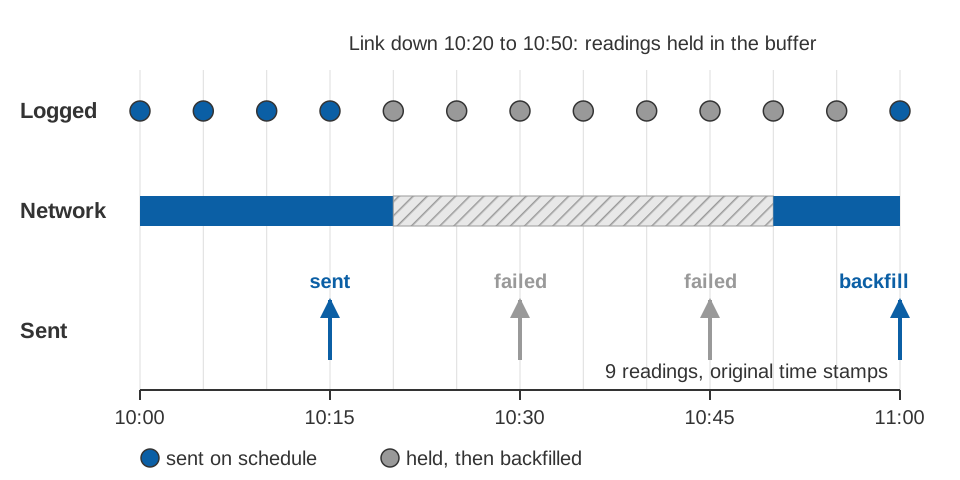
Two choices matter here. For a warning station, newest first gets the current state of the river onto the screen immediately, and the history follows. And the buffer must be large enough for the longest outage you expect: at 11 bytes per reading, even a week of 5-minute readings (2,016 readings) is about 22 kB, so memory is rarely the limit, but the time to send the backlog over a weak link can be.
5 to 7. Arrival, checks and storage
The ingest service receives the message, checks who sent it and acknowledges it. Then the checks begin.
De-duplication. With QoS 1, HTTPS retries and backfill, duplicates are normal, not an error. The robust approach is to give each reading a natural key, station plus parameter plus measurement time, and to write it as an upsert: insert if new, otherwise leave the existing value alone. Sending the same reading twice then has the same effect as sending it once, which is exactly the idempotence that HTTP asks for [2].
Validation. Is the value inside the sensor's physical range? Is the time stamp in the future, or years in the past? Did the river rise faster than is physically possible? Is the value unchanged for far too long?
Quality flags. A check should not delete a value. It should attach a quality flag, a code stored next to the value that records the result: for example good, suspect, bad, missing or estimated. SensorThings gives each observation a resultQuality property that "describes the quality of the result" [4]. Keeping the raw value lets a reviewer overturn an automatic decision. How these checks work is the subject of data quality control for hydromet time series.
Storage. The reading then goes into a time-series database, built for values indexed by time, together with the metadata needed to interpret it: station, sensor, units and datum. SensorThings, for example, groups observations into Datastreams, each "a collection of Observations measuring the same ObservedProperty and produced by the same Sensor" [4].
8. The screen
The dashboard shows current values, recent history and the state of each station. Three features decide whether it helps during a flood.
- Thresholds and alerts. Warning and danger levels are stored per station, and an alert fires when a valid reading crosses one. Rules should use the measurement time, respect the quality flag, and use a small margin between the level that raises an alert and the level that clears it, so that a value wobbling around the threshold does not fire repeatedly.
- Data age. Every value should show how old it is. A silent station must look different from a calm river, and a "no data" alarm matters as much as a high-level alarm.
- Backfilled data. When nine readings arrive at once after an outage, a threshold crossing may be 35 minutes old. Usually the right answer is to alert, clearly marked as late, rather than stay silent or pretend it is new.
Adding up the delay
End-to-end latency is the time between the river reaching a level and that level appearing on a screen. It is the sum of the stages:
latency = averaging lag + wait until logged + wait until transmitted
          + network delay + server processing
With a fixed transmit schedule, the wait for the next transmission usually dominates. Take an illustrative station with a 60-second averaging window, 5-minute logging, a transmission every 15 minutes, 10 seconds of network delay and 5 seconds of server processing.
Worst case, the river crosses a threshold just after a transmission. The change is logged within 5 minutes, but it waits for the next transmission, 15 minutes after the last one:
worst case = 0.5 min (half of 60 s)  + 15 min (next transmission)
             + 0.17 min (10 s) + 0.08 min (5 s)
           ≈ 15.8 min
average    = 0.5 + 7.5 + 0.17 + 0.08 ≈ 8.3 min
Note that the logging interval does not appear: every reading logged in the 15 minutes is sent at the same moment. Now let the logger send at once whenever a reading crosses a threshold. The wait is then the logging interval:
worst case = 0.5 + 5 + 0.17 + 0.08 ≈ 5.8 minWhy this matters: if the river is rising at 1 m per hour (an illustrative rate), 15.8 minutes of delay means it is already about 26 cm higher (1 m/h × 15.8/60 h) than the dashboard shows. On a flashy hill stream (see flash floods vs river floods) that can be a large share of the warning time. The cheapest improvement is usually not a faster network but a smarter transmit rule: send immediately when the river is high or rising.
Try a 15-minute transmit interval, then tick the threshold box, then try a 10-minute averaging window.
Security basics
Telemetry drives public warnings, so security is part of the chain, not an add-on. At a minimum, encrypt every message in transit with TLS, the protocol that secures HTTPS and is designed "to prevent eavesdropping, tampering, and message forgery" [3]; give each station its own credentials, so that one stolen logger does not expose the others; and let each station publish only to its own topics, as the MQTT standard recommends [1]. Signed firmware updates, keys, access control and a checklist for buyers are covered in security for field IoT devices.
Key points
- Time-stamp each reading at the station with the time it was measured, not the time it arrived.
- Compact binary payloads can be ten times smaller than JSON; version and checksum every format.
- MQTT with QoS 1 suits the main channel, HTTPS suits batches, SMS is a fallback. Remove duplicates on the server.
- Store and forward with confirmed delivery turns an outage into a delay, not a loss.
- Latency is the sum of the stages and, on a fixed schedule, is dominated by the transmit interval. Sending at once on threshold crossings cuts it most cheaply.
- Flag suspect values rather than deleting them, and show the age of every value.
Getting readings from the riverbank to the people who act on them is at the centre of ClimMaTech's work on flood early warning in the Himalaya. To see how we approach it, visit our Visiflow (Device Cloud) platform page and our RTDAS and hydromet telemetry solution page.
References
- OASIS, MQTT Version 5.0, OASIS Standard, 7 March 2019. docs.oasis-open.org.
- R. Fielding, M. Nottingham, J. Reschke (eds.), HTTP Semantics, RFC 9110, Internet Engineering Task Force, 2022. rfc-editor.org.
- E. Rescorla, The Transport Layer Security (TLS) Protocol Version 1.3, RFC 8446, Internet Engineering Task Force, 2018. rfc-editor.org.
- Open Geospatial Consortium, OGC SensorThings API Part 1: Sensing, Version 1.1, OGC 18-088, 2021. docs.ogc.org.
- World Meteorological Organization, WIS2 Overview, WMO Community website. community.wmo.int.
- ETSI / 3GPP, Technical realization of the Short Message Service (SMS), ETSI TS 123 040 V17.3.0 (3GPP TS 23.040 Release 17), 2023. etsi.org.
- C. Bormann, P. Hoffman, Concise Binary Object Representation (CBOR), RFC 8949, Internet Engineering Task Force, 2020. rfc-editor.org.