
Impact-based forecasting and warnings
Why a warning should say what the weather will do, not only what it will be, and how a likelihood-and-impact matrix turns a forecast into a colour and an action.

Two valleys in the same district receive the same forecast: heavy rain tonight. In the first, a market and a footbridge stand beside a stream. In the second, the stream runs between empty terraced slopes. A warning that only quotes the rainfall treats both alike. Impact-based forecasting does not. It asks what that rain will do to the people, roads and property in the path of the water, and then tells them what to do. This article explains the idea, the matrix behind it, how India's weather service uses it, and where it is still hard.
What is impact-based forecasting?
Impact-based forecasting is forecasting that describes the expected consequences of a hazard, not just the hazard itself. The World Meteorological Organization (WMO) puts the shift in a single phrase: from what the weather will be to what the weather will do [1].
The WMO's 2015 Guidelines on Multi-hazard Impact-based Forecast and Warning Services (WMO-No. 1150) start from a puzzling fact. Many severe events are "well forecast, with accurate warning information disseminated in a timely fashion", and yet people still die and property is lost. The Guidelines trace this to a gap between the forecast and "an understanding of their potential impacts" [1]. An accurate and timely warning, they note, "does not guarantee safety of life or prevent major economic disruption" [1].
What is the definition of impact-based forecasting?
The Guidelines define three paradigms, and the difference is worth keeping straight [1]:
| Paradigm | What it contains | WMO's example |
|---|---|---|
| Weather forecast or warning | Hazard only | "Severe thunderstorms are expected today with wind gusts exceeding 60 mph." |
| Impact-based forecast or warning | Hazard and vulnerability | "Severe thunderstorms with gusts over 60 mph will result in damage to trees and power lines." |
| Impact forecast or warning | Hazard, vulnerability and exposure, down to a community or activity | "Extensive traffic delays in Kensington may occur due to the risk of large trees downing power lines and blocking roads." |
The terms in the second column are defined in the same document. A hazard is the element that poses a threat, such as intense rain. Exposure is who and what may be affected in the area where the hazard can occur. Vulnerability is how susceptible those exposed people and assets are to harm. Risk is "the probability and magnitude of harm" to people and their livelihoods because of their exposure and vulnerability to a hazard [1]. Exposure is necessary but not sufficient for risk. A family can live on a floodplain and still be able to protect itself, for example, through how the house is built and how they behave [1].
The WMO also draws a line of responsibility. The final step, forecasting actual impacts for a specific community, needs demographic data, mapping and local knowledge that a meteorological service rarely holds alone. For many countries it is the job of the disaster management agency, working with the weather service [1]. A 2021 second part of the Guidelines, Putting Multi-hazard IBFWS into Practice, collects implementation experience [2].
How does the WMO risk matrix work?
The WMO risk matrix works by assigning every warning a colour that combines two judgements: how severe the impact could be, and how likely it is. The Guidelines recommend that weather services and disaster management agencies together build such a matrix, "expressing risk through a simple 'traffic-light' colour scheme" [1].
In the WMO example, taken from the UK Met Office, the colours mean: green, no severe hazard expected; yellow, be aware; orange, be prepared; red, take action [1]. The matrix replaces a plain yes-or-no threshold with two benefits. It can express a potential impact "well in advance of a significant hydrometeorological event", and it can show changing risk as likelihood, exposure and vulnerability change [1].
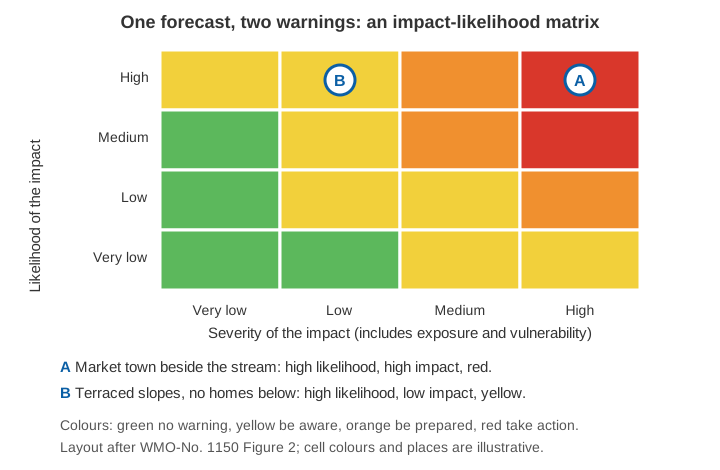
Worked example (illustrative)
Suppose the rainfall forecast for tonight is the same for both valleys, and forecasters judge a heavy burst likely. Nothing else about the rain differs.
- Valley A. The market lies on low ground by the stream and the footbridge is the only way to the school. Impact if the stream overtops: high. Likelihood of that impact: high. The matrix gives red, with the action "keep away from the stream and move goods and vehicles to higher ground".
- Valley B. The slopes carry terraces but no homes or roads below them. Impact: low. Likelihood: high. The matrix gives yellow, with the action "be aware; farm work near the channel should wait".
The forecast, a hazard, was one number. The warnings differ because exposure and vulnerability differ. A fixed rainfall threshold could not have separated these two cases.
How is impact-based forecasting used in India?
The India Meteorological Department (IMD) issues what it calls an impact-based weather warning. Its All India Impact Based Weather Warning Bulletin of 31 May 2021, for example, lists for each hazard an "Impact Expected" section and an "Action Suggested" section. For heavy rainfall, it names consequences such as "localized flooding of roads, water logging in low lying areas and closure of underpasses mainly in urban areas" [3]. Each bulletin carries a colour code and a standing note that a red warning "does not mean 'Red Alert'", but "Take Action", and that a day's forecast is valid from 0830 hours IST to 0830 hours IST the next day [3].
The research on how this works for people is still sobering. A 2024 study by Biswanath Dash examined IMD's impact-based framework through fieldwork in Krushnaparasad Block, Puri district. It concluded that the service was shifting its focus to the general public but had a long way to go. It called for stronger risk assessment modelling, clearer institutional mandates and flexible governance [4]. In the author's own summary of the group discussions, participants largely overlooked the colour codes and relied on television and radio, and they wanted warnings that named specific consequences such as crop damage [5].
At district level, Singhal and colleagues proposed an impact-based framework for 32 districts in eastern Uttar Pradesh. They combined extreme rainfall forecasts at 70 mm and 100 mm thresholds with population, poverty, agriculture and economic data, and produced a matrix with "very low" to "high" categories and a suggested action for each. They also found that the raw forecasts matched satellite rainfall estimates well in some districts and poorly in others, and concluded that the data was "still inadequate to be used by the end-users in its raw form" [6]. Impact-based warnings can only be as good as the forecast beneath them.
What makes impact-based warnings difficult?
Four problems come up repeatedly.
- Exposure and vulnerability data are hard to get and keep current. Building footprints, road networks, population by hour of day, and crop calendars sit with different agencies. The WMO says outright that this is why partnerships are required [1].
- Judging likelihood and severity together is not neutral. In two studies with 363 forecasters from four Southeast Asian weather services, forecasters gave higher likelihoods to high-severity impacts than to low-severity ones, even when both were described with the same numerical probability. The authors call this a "severity effect", and it also appeared when warnings made on a risk matrix were translated back into probabilities [7]. A matrix does not remove human judgement; it makes it visible.
- Colours do not carry the message alone. The Puri fieldwork shows that a colour is useful only if people know what it means and trust the source [5]. Hence the "Action Suggested" text.
- Validation is harder than verifying rainfall. The WMO recommends developing impact-based monitoring to check warnings against what actually happened, and reviewing significant events with all the partners involved [1].
Where do river and rain measurements fit?
An impact statement is a claim about the ground, and ground measurements test it. A river gauge reading says how high the water is at a section; whether that matters depends on the levels at which a road, a bridge approach or a settlement begins to flood. That is the logic of warning and danger levels, explained in warning level vs danger level for river gauges. It is also why local rainfall and level records are needed to learn how a particular catchment responds, as in flash floods vs river floods. The inputs to the hazard side are covered in nowcasting and ensemble forecasts, and the whole chain in how a flood early warning system works.
Key points
- Impact-based forecasting moves a warning from "what the weather will be" to "what the weather will do" [1].
- The WMO separates hazard-only warnings, impact-based warnings (hazard and vulnerability) and impact forecasts (hazard, vulnerability and exposure) [1].
- A risk matrix of likelihood against impact gives the colour: green, yellow (be aware), orange (be prepared), red (take action) [1].
- IMD's impact-based bulletins state the impact expected and the action suggested, but field research finds that colour codes alone are often not understood [3][4][5].
- The quality of the forecast, the exposure data and the forecasters' own judgement all limit how good an impact warning can be [6][7].
Where ClimMaTech fits
Impact warnings are only useful if the last step reaches the people at risk, and if local observations show whether the expected impact is arriving. At ClimMaTech we work on that local part of the chain: river and rainfall monitoring at the section, and flood warning at the community. Rakshak is a multi-hazard warning siren with a library of 15-20 user-selectable siren tones and voice messages, so the message can match the action being asked of people.
References
- World Meteorological Organization, WMO Guidelines on Multi-hazard Impact-based Forecast and Warning Services, WMO-No. 1150, Geneva, 2015. etrp.wmo.int
- World Meteorological Organization, WMO Guidelines on Multi-hazard Impact-based Forecast and Warning Services, Part II: Putting Multi-hazard IBFWS into Practice, 2021 (companion page). community.wmo.int
- India Meteorological Department, All India Impact Based Weather Warning Bulletin, 31 May 2021 (evening issue). static.pib.gov.in
- B. Dash, Gap between impact-based and impact forecast and warning: Implications for people-centric early warning system (EWS) in India, Natural Hazards Research, 2024. doi:10.1016/j.nhres.2023.09.005
- B. Dash, Advancing people-centric early warning systems, India Water Portal, updated 14 November 2023 (the author's summary of reference 4). indiawaterportal.org
- A. Singhal, A. Raman, S. K. Jha, Potential use of extreme rainfall forecast and socio-economic data for impact-based forecasting at the district level in northern India, Frontiers in Earth Science 10, 2022. doi:10.3389/feart.2022.846113
- E. Liefgreen et al., Severity influences categorical likelihood communications: a case study with Southeast Asian weather forecasters, Scientific Reports, 2024. doi:10.1038/s41598-024-64399-5