
Warning level vs danger level for river gauges
What the warning level, danger level and highest flood level on a CWC river gauge mean, how they set the yellow, orange and red flood categories, and how they differ from IMD's rainfall alerts.

A district control room hears that the river is "above warning level" in the morning and "near danger level" by evening. How worried should it be? Warning level vs danger level is simple once you see the three lines on one river cross-section. This article explains what each line means in Central Water Commission (CWC) practice, the flood categories built on them, and the difference between a flood alert and a flood warning.
What do warning level, danger level and HFL mean?
They are three water levels fixed for each CWC flood forecasting station, and each one marks the start of a flood category [1].
- Warning level (WL) is the level at which flood forecasting begins. CWC issues a level forecast "once the water level in a river touches or is expected to touch the pre-defined Warning Level", which is "usually 1 meter below the Danger Level, but also dependent on the threat perception of the particular location" [1].
- Danger level (DL) is the level at or above which CWC classes the situation as a severe flood [1].
- Highest flood level (HFL) is "the highest flood level of the river ever recorded at the place" [1]. CWC's procedure asks its offices to update HFLs that were surpassed, and, for a site at or near a bridge, to compare its own highest observed level with the HFL used to design the bridge and adopt the higher of the two [1].
CWC reviews the warning and danger levels of its level forecast stations as part of its preparation before each flood season [1]. The gap between them is a matter of local judgement, not a fixed rule. At Delhi Railway Bridge on the Yamuna, for example, the bulletins list a warning level of 204.50 m and a danger level of 205.33 m, a gap of 0.83 m [2].
What are the three levels of flood warning?
CWC sorts its level forecasting sites into three flood situations, each with a colour [1][2]:
| Situation | Water level at the site | Colour | Reporting |
|---|---|---|---|
| Above normal | At or above warning level, below danger level | Yellow | Listed in the daily bulletin |
| Severe | At or above danger level, below HFL | Orange | Orange bulletin every 6 hours |
| Extreme | Equal to or above the previous HFL | Red | Red bulletin every 3 hours |
Below the warning level a site falls in none of the three categories, and no level forecast is issued unless the level is expected to reach the warning level [1]. Each daily flood bulletin counts the sites in each category and lists every site's levels, latest observation and forecast [2]. The orange and red alerts go to senior disaster management officials of the Government of India, nodal officers of the National Disaster Management Authority (NDMA) and the National Disaster Response Force, and the state and union territory governments concerned [1].
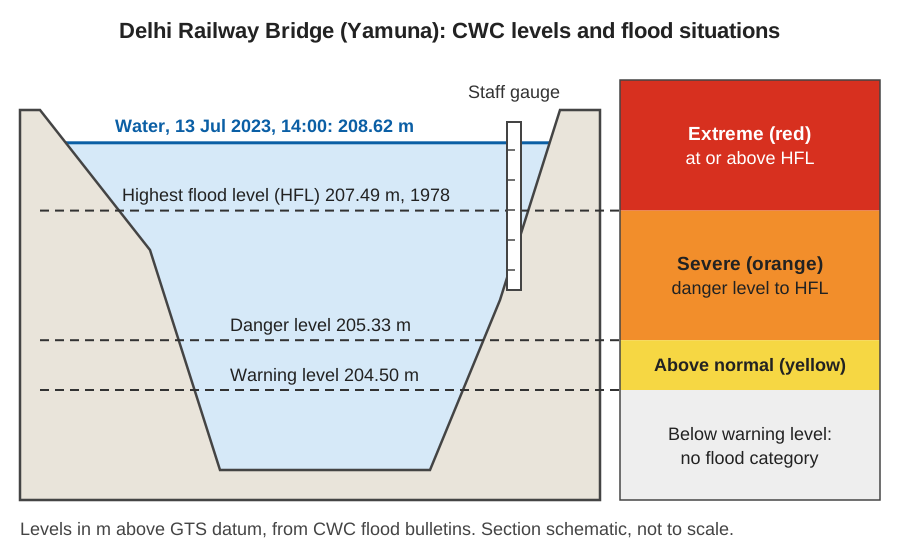
Worked example: the Yamuna at Delhi, July 2023
The CWC bulletins for this site show how one station moves through the categories [2][3].
| Time | Observed level | Compared with the site's levels | Category |
|---|---|---|---|
| 10 July 2023, 13:00 | 204.63 m, rising | 204.63 − 204.50 = 0.13 m above WL; 205.33 − 204.63 = 0.70 m below DL | Above normal (yellow) |
| 13 July 2023, 14:00 | 208.62 m | 208.62 − 207.49 = 1.13 m above the 1978 HFL | Extreme (red) |
On 10 July the bulletin also forecast 205.5 m for 11:00 the next day, above the danger level [2]. On 13 July Delhi was the only CWC site in the extreme category [3]. Under CWC's procedure, the HFL of a site is updated once a flood has surpassed it, so the 1978 figure no longer stands as the record here [1].
Level forecasts and inflow forecasts
CWC issues two kinds of flood forecast. A level forecast predicts the water level at a river station and is tied to the warning and danger levels; it helps local administrations decide on measures such as evacuation [1]. An inflow forecast predicts the flow into a dam, reservoir or barrage and is issued when inflow exceeds a threshold set for that structure, so that operators can plan releases [1]. CWC judges a level forecast correct if the observed level is within ±15 cm of the forecast, and an inflow forecast if the observed inflow is within ±20 % [1]. The flood categories above apply only to level forecast sites; an inflow site has a threshold, not a danger level.
Why the danger level only works on its own datum
A danger level is a number on one gauge, not a universal depth. CWC measures river stage "as its elevation above the GTS datum", not as a depth of water, which is why Delhi's levels are around 205 m [4]. A local staff gauge or an automatic sensor may report the same water as, say, 3.4 m above its own zero. If the danger level is copied into a new system without converting it to that system's zero, the alarm will fire at the wrong water level. A change of 1 m in gauge zero shifts every threshold by 1 m. Our article on gauge zero, datum and benchmarks works through this conversion.
The thresholds are also site-specific because rivers are. A danger level suited to one bridge says nothing about a town downstream, where the channel, embankments and floodplain differ. That is why CWC sets the warning level by "threat perception of the location" [1] and lists each station's levels separately [2].
What is the difference between a flood alert and a flood warning?
In India's official colour codes, an alert means "be prepared" and a warning means "take action". The India Meteorological Department (IMD) uses four colours for weather warnings: green for no warning (no action), yellow for a watch (be updated), orange for an alert (be prepared) and red for a warning (take action) [5]. IMD assigns the colour for each district from both the probability of the event and its expected impact [5].
The two systems answer different questions:
- IMD colour codes describe expected weather, such as heavy rainfall in a district over the next five days [5]. An orange alert means rain heavy enough to cause impacts is likely, not that a river has risen.
- CWC categories describe a river level at a gauge, observed or forecast, against that site's warning level, danger level and HFL [1][2].
The colours look alike but the scales differ. IMD's yellow is a watch on the weather; CWC's yellow means a river has already reached its warning level. Rain can come before any river rises, and a river can rise days after rain far upstream, so a district needs both. For how these signals become action on the ground, see how a flood early warning system works. For reading a flood record afterwards, see what a hydrograph tells you.
Key points
- Warning level starts CWC level forecasting; it is usually 1 m below danger level, adjusted to local threat.
- Above warning level is "above normal" (yellow), above danger level is "severe" (orange), and at or above the HFL is "extreme" (red).
- The HFL is the highest level ever recorded at the site and is raised when a flood beats it.
- Levels are elevations on the station's datum; a threshold is valid only on the same zero as the reading.
- IMD's alert (orange, be prepared) and warning (red, take action) describe weather; CWC's categories describe river levels.
Where ClimMaTech fits
At ClimMaTech we build river monitoring for flood warning, where a reading is useful only when it is compared with the right threshold on the right datum. Tarang, our AWLR (Automatic Water Level Recorder), records river level automatically and sends it over the network, with a stated accuracy of ±1 mm under ideal conditions; like any sensor, it must be set to the same datum as the site's warning and danger levels. Read more on our flood warning page.
References
- Central Water Commission, Standard Operating Procedure for Flood Forecasting, Ministry of Jal Shakti, Government of India, April 2025. cwc.gov.in
- Central Water Commission, Central Flood Control Room, Daily flood bulletin: Flood Situation Summary, Bulletin No. 71, 10 July 2023. cwc.gov.in
- Central Water Commission, Central Flood Control Room, Daily flood bulletin: Flood Situation Summary, Bulletin No. 74, 13 July 2023. cwc.gov.in
- Central Water Commission, Gauge Observations, Ministry of Jal Shakti. cwc.gov.in
- India Meteorological Department, Standard Operation Procedure: Weather Forecasting and Warning Services, Ministry of Earth Sciences, 2021. mausam.imd.gov.in