
Landslide early warning systems in India
How rainfall thresholds, ground sensors and the field signs people can see are combined into a landslide early warning system, and what India's national forecasting effort looks like.

A slope above a village in the Himalaya has stood for decades. Then three days of heavy monsoon rain arrive, and someone has to decide whether tonight is the night to move families out. A landslide early warning system (LEWS) exists to make that decision with evidence instead of fear: it watches the things that precede a failure, compares them with agreed limits, and passes a clear message to the people at risk. This article explains how a landslide early warning system in India is built, what rainfall thresholds can and cannot tell you, which sensors are used on slopes, and which signs on the ground people can read for themselves.
Why landslides need their own warning systems
India's National Disaster Management Authority (NDMA) states that landslides affect about 15 % of the country's land area, over 0.49 million km², with frequent occurrences in the Himalaya and the North-East, and in the Western Ghats and Nilgiri hills in the south [1]. Most of these are triggered by rain, which is why the monsoon is also the landslide season.
A flood on a large river gives hours or days of warning because water takes time to travel downstream. A slope gives far less. The trigger and the failure are on the same hillside, so warning has to be built from rainfall and from small changes in the slope itself. NDMA's guidelines are candid about the state of practice: they note that landslide monitoring "is generally not practiced" in the country and that it is not possible to instrument every slope, so a few landslides with the potential for catastrophe are chosen for monitoring and early warning [1]. This is the first design choice in any system: which slopes, and which scale?
Researchers distinguish two scales [6]:
- Local systems watch one known slope with instruments and, often, with trained villagers.
- Territorial (regional) systems cover a district or state and forecast where landslides become likely, using rainfall as the main input.
The two answer different questions and are usually complementary. The territorial system says "this district is in a high-risk window today". The local system says "this particular slope is now moving".
What are the parts of a landslide early warning system?
A complete LEWS has four linked parts, the same four that NDMA's guidelines list for any early warning system: risk knowledge (which slopes and which people are exposed), monitoring and warning services, dissemination and communication, and response capability. The guidelines add that the weakness or failure of any one of them can cause the whole system to fail [1]. A flow-chart approach to choosing and designing these parts for single slopes is given by Intrieri and co-authors [7].
This is why a sensor on its own is not an early warning system. A rain gauge that reports to a screen nobody watches, or a threshold that nobody has agreed how to act on, is only a measurement. We cover how the messages reach people in how a flood early warning system works and early warning dissemination: sirens, SMS and CAP; the same chain applies to slopes.
How do rainfall thresholds work?
A rainfall threshold is the minimum rainfall, described by its amount and duration, above which landslides become likely in an area. It is the workhorse of territorial systems because rainfall is measured widely and forecast routinely.
The classic form is the intensity-duration (ID) threshold: the mean rainfall intensity (mm per hour) plotted against the duration of the rain event (hours), usually on logarithmic axes, where the threshold appears as a falling straight line. The longer the rain lasts, the lower the intensity needed. Guzzetti and co-authors compiled a global database of 2,626 rainfall events that triggered shallow landslides and debris flows and found that the minimum intensity likely to trigger failure decreases linearly on log axes over durations from 10 minutes to 35 days. Their global thresholds are lower than those proposed earlier by Caine in 1980, and they suggest using them in a warning system only where local or regional thresholds are not available [2].
Three points follow from this literature.
- Thresholds are local. The same rainfall that is harmless on one slope may bring down another. When the Geological Survey of India (GSI) and Italy's CNR IRPI derived thresholds for Darjeeling and the Nilgiris, from 84 and 116 rainfall conditions respectively, the Darjeeling thresholds came out higher: at any duration, more rain was needed there, consistent with its monsoon regime [9].
- Thresholds have probabilities. A threshold is not a line between safe and unsafe. Modern practice fits lines at several exceedance probabilities and uses them as warning levels. Brunetti and co-authors proposed four thresholds, each at a different exceedance probability, that divide the intensity-duration plane into five fields with different likelihoods of landslides [4]. A review of the 115 thresholds published over nine years noted that validation is seldom carried out [5].
- Data quality sets the ceiling. In the Darjeeling and Nilgiris work, landslide dates were often imprecise and rainfall was only available daily, so the team had to revise how triggering rainfall was identified [9]. A broader study of operating systems notes that errors of more than a day in the time of triggering can significantly affect a threshold [6].
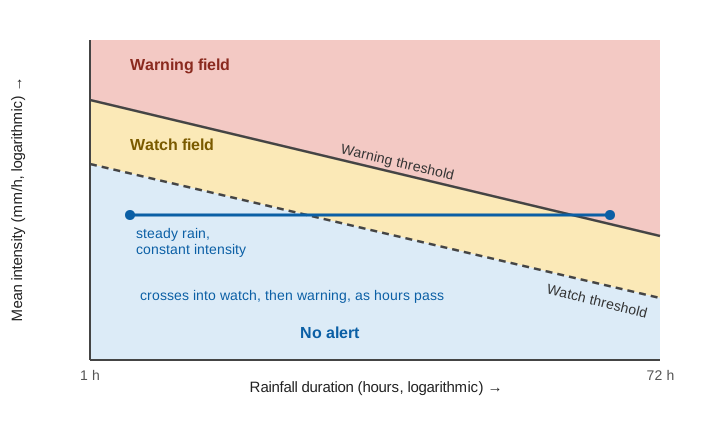
Worked example: reading a threshold (illustrative)
Suppose a district uses two illustrative thresholds, expressed as mean intensity I in mm/h against duration D in hours:
Watch threshold:    I = 10 × D^-0.6
Warning threshold:  I = 20 × D^-0.6

Storm so far: 40 mm in 6 h  ->  I = 40 / 6 = 6.7 mm/h
  Watch at 6 h:    10 × 6^-0.6 = 3.4 mm/h   (exceeded)
  Warning at 6 h:  20 × 6^-0.6 = 6.8 mm/h   (just not exceeded)

Six hours later: 70 mm in 12 h  ->  I = 70 / 12 = 5.8 mm/h
  Warning at 12 h: 20 × 12^-0.6 = 4.5 mm/h  (exceeded)
Nothing changed about the slope; the rain simply kept falling, and the longer duration lowered the intensity needed. Expressed as cumulative rainfall, the same curves are E = 10 × D^0.4 and E = 20 × D^0.4 mm:
The practical point is that a threshold system needs rain measured at short intervals, close to the slope. A daily total hides whether 80 mm fell in three hours or in twenty-four. NDMA's guidelines make the same point: high-intensity, short-duration rainfall generally triggers catastrophic landslides, and automatic rain gauges should be installed at landslide locations [1]. For gauge siting and error sources, see tipping-bucket rain gauge errors, siting and calibration.
An older Indian rule: the event coefficient
The NDMA guidelines also record an Indian study from the 1980s that related landsliding to an event coefficient, the ratio of an event's rainfall to the mean annual rainfall at the location. Event coefficients above 20 % triggered heavy landslides at all times, 10-20 % gave a very high probability, and below 5 % the probability was very low. The guidelines describe it as suggestive of the kind of study needed, not as a standard [1]. As an illustration, at a place with 1,500 mm of mean annual rainfall, 20 % is 300 mm and 5 % is 75 mm for one event. Such a rule is crude, but it shows why a threshold must be scaled to the local climate.
Which sensors are used for landslide monitoring?
Where a particular slope matters, such as above a settlement, a road or a rail line, rainfall is joined by sensors on and in the ground. NDMA's guidelines group the measurements into surface movement, sub-surface movement and the "total regime" of groundwater and rainfall [1].
| What is measured | Instrument (from NDMA's guidelines) | What it tells you |
|---|---|---|
| Rainfall | Automatic rain gauge at the site | Intensity and duration, to compare with thresholds |
| Pore water pressure and groundwater | Piezometers (hydraulic, pneumatic, electrical) at different depths | Water pressure in the slope, a direct driver of failure |
| Surface cracks and displacement | Crack measurement, wire extensometers, GPS | Whether and how fast the surface is opening or moving |
| Movement below the surface | Inclinometers, strain probes, extensometers in boreholes | Depth and rate of creep |
| Moving debris | Wire switches, tilting poles, photo-electrical barriers | A trigger when material is already moving |
| Visual record | Auto-actuated photographic systems | Evidence of what happened and when |
Source for the instruments: NDMA [1]. The guidelines add that all instruments can be connected to data loggers at the site, which send data to processing stations by telemetry, so that results can be processed automatically and used to issue warnings [1]. They also stress that real-time monitoring is costly and risks losing expensive instruments on active slopes, so it should be reserved for landslides with the potential to collapse catastrophically and threaten life [1].
Not every system needs to be sophisticated. NDMA notes a common notion that landslide warning systems are always complex and expensive, and says that in many situations simple, inexpensive instruments on easily measurable indicators can give premonitions of failure [1]. It also states that there are no standard ready-made packages: instruments and tools must be fashioned to suit a particular slope, the type and size of the landslide, and the purpose of the alert [1].
A deployment from India: Munnar
One documented Indian example is the wireless sensor network built by Amrita University at Munnar in Idukki district, Kerala. A pilot began in March 2008 and an expanded deployment in January 2009. It used six sensor columns, each roughly 20-25 m long, drilled into the slope, with eight sets of geophysical sensors distributed inside them. Wireless nodes collected the data and passed it through a gateway and a directional Wi-Fi link to a field data centre and then by satellite to a processing centre about 252 km away [12]. The project's own page does not publish alert levels, so we cannot say what limits it used; we mention it as an example of the architecture: sensors in the ground, a local network, a telemetry link and a processing centre.
What are the landslide early warning signs?
Instruments are not the only evidence. NDMA lists signs that "often provide irrefutable evidence of unsatisfactory slope behaviour": development and widening of cracks, tilting of trees and poles, sudden oozing out of water or drying of springs, sub-slope piping, erosion at the base of the slope, sudden boulder falls, slope subsidence or heave, and cracking of building floors [1]. A caution comes in the same passage: random, isolated observations do not convey much, but when evidence is collected, analysed and connected with other inputs, early warning alerts become possible [1].
The guidelines therefore call for local committees to be identified and trained to discern these signs, gather information and pass it to disaster management cells, and describe monitoring by educated, aware communities as the most valuable and reliable information base for an effective system [1]. In practice this means:
- A named observer for each at-risk slope, with a simple record of cracks and springs checked after heavy rain.
- A single route for reports, so that a village observation reaches the district control room.
- A response rule agreed in advance: who decides, and what people do when the alert comes.
NDMA also warns that even with the best system the results can be catastrophic if signals are not properly interpreted and communities are not trained to respond [1]. The wording of the message matters; see writing warning messages people act on and India's colour-coded weather warnings explained.
India's national landslide forecasting effort
At territorial scale, India's effort is led by GSI. Its work grew out of LANDSLIP (Landslide Multi-Hazard Risk Assessment, Preparedness and Early Warning in South Asia), a project that ran from 1 November 2016 to 31 October 2020 with partners including King's College London, the British Geological Survey, Practical Action, CNR IRPI, the UK Met Office, Amrita Vishwa Vidyapeetham and GSI. IRPI's role was to define empirical rainfall thresholds using methods developed in Italy and to implement them in operational forecasting, with the pilot areas being Darjeeling and the Nilgiris [8]. The thresholds were implemented in the LANDSLIP prototype early warning system, and the authors plan to refine them as new landslide and rainfall data become available [9].
GSI has since set up the National Landslide Forecasting Centre (NLFC) in Kolkata. At its first anniversary workshop in July 2025, GSI's Director General said coverage had grown from 16 districts in six states at the start to 21 districts in eight states, that a nationwide regional landslide early warning system is the aim by 2030, and that research on AI-based forecasting is under way. The centre's dashboard, the Bhusanket portal and the Bhooskhalan app are used for monitoring and public access to forecasts [10]. Earlier in 2025, reports described operational bulletins for Darjeeling and Kalimpong in West Bengal and the Nilgiris in Tamil Nadu, while GSI projects covering 16 districts in 11 states, Himachal Pradesh among them, received daily experimental bulletins for ground validation during the monsoon [11].
These are district-scale forecasts. They tell authorities where conditions are likely to produce landslides, not which hillside will fail or at what hour. The wider evidence agrees that this is the realistic aim. A review of 26 regional, national and global systems running from 1977 to August 2019 found that only five nations, 13 regions and four metropolitan areas had one, while many areas with numerous fatal landslides had none. The same review found no accepted standard for checking the skill of a system, and concluded that operational forecasting of weather-induced landslides is feasible and can help reduce risk [3].
Where thresholds and sensors fall short
Honest limits belong in any design:
- Thresholds miss non-rain triggers, such as earthquakes, undercutting by rivers, or road cutting. They also say little about a slope already weakened by earlier seasons unless antecedent wetness is included.
- Rain gauges are points; hillsides are not. A gauge in the valley may not see the cell over the ridge, which is why rainfall radar and satellite estimates are used alongside gauges [3].
- False alarms and missed events are both costly. Lower thresholds catch more events but raise false alarms, and repeated false alarms teach people to ignore the next one. A validation record is what lets an agency choose a level on evidence [5].
- Instruments on active slopes get damaged and need maintenance, which NDMA lists among the main challenges of establishing and maintaining monitoring at identified locations [1].
- Warning time is short on small slopes and depends on the type of failure; the guidelines note that early warning schemes for debris flows and rockfalls differ greatly from those for block slides [1].
Because of these limits, the systems that work best combine layers: a regional forecast to raise attention, local rain and slope measurements to sharpen it, trained observers on the ground, and a rehearsed response. Norway's national service, to take one validated example, reported more than 95 % correct daily assessments over four years of operation [6]; we cite it to show what a documented performance record looks like, not as a figure that transfers to Indian slopes.
Key points
- A landslide early warning system is more than sensors: it needs risk knowledge, monitoring, communication and a trained response [1].
- Territorial systems forecast where landslides are likely using rainfall thresholds; local systems watch a specific slope with instruments and observers [6].
- Intensity-duration thresholds fall with duration, are local to each region, and work best as several probability levels with a validation record [2][4][5].
- Short-interval rain data close to the slope is the most valuable input; daily totals hide the intensity that matters [1][9].
- Slope signs such as new cracks, tilting trees and changes in springs are real evidence and need a named observer and a reporting route [1].
- GSI's forecasting centre issues district-scale bulletins for a growing number of districts; they are not forecasts for individual slopes [3][10][11].
Where ClimMaTech fits
At ClimMaTech we work on rain and river monitoring for early warning in hill catchments, and rainfall measured at short intervals close to the hazard is the input every threshold system depends on. Our VARSHAQ rain and weather station is in development, and the VARSHAQ page describes it. For how rain, river level and alerts are combined in practice, see our flood warning solution and the article on river monitoring in hill and Himalayan catchments.
References
- National Disaster Management Authority, Government of India, National Disaster Management Guidelines: Management of Landslides and Snow Avalanches, New Delhi, June 2009 (chapters 1 and 5). ndma.gov.in
- F. Guzzetti, S. Peruccacci, M. Rossi, C. P. Stark, The rainfall intensity-duration control of shallow landslides and debris flows: an update, Landslides 5(1), 3-17, 2008. doi:10.1007/s10346-007-0112-1
- F. Guzzetti, S. L. Gariano, S. Peruccacci, M. T. Brunetti, I. Marchesini, M. Rossi, M. Melillo, Geographical landslide early warning systems, Earth-Science Reviews 200, 102973, 2020. doi:10.1016/j.earscirev.2019.102973
- M. T. Brunetti, S. Peruccacci, M. Rossi, S. Luciani, D. Valigi, F. Guzzetti, Rainfall thresholds for the possible occurrence of landslides in Italy, Natural Hazards and Earth System Sciences 10(3), 447-458, 2010. doi:10.5194/nhess-10-447-2010
- S. Segoni, L. Piciullo, S. L. Gariano, A review of the recent literature on rainfall thresholds for landslide occurrence, Landslides 15(8), 1483-1501, 2018. doi:10.1007/s10346-018-0966-4
- S. Segoni, L. Piciullo, S. L. Gariano, Preface: Landslide early warning systems: monitoring systems, rainfall thresholds, warning models, performance evaluation and risk perception, Natural Hazards and Earth System Sciences 18, 3179-3186, 2018. nhess.copernicus.org
- E. Intrieri, G. Gigli, N. Casagli, F. Nadim, Landslide early warning system: toolbox and general concepts, Natural Hazards and Earth System Sciences 13, 85-90, 2013. doi:10.5194/nhess-13-85-2013
- CNR IRPI, LANDSLIP: Landslide Multi-Hazard Risk Assessment, Preparedness and Early Warning in South Asia (project page), 2016-2020. irpi.cnr.it
- M. Melillo, S. L. Gariano, M. T. Brunetti, M. Rossi, S. Kumar, R. Mathiyalagan, S. Peruccacci, Frequentist rainfall thresholds for landslide forecasting in the Darjeeling and Nilgiris districts in India, EGU General Assembly 2023, abstract EGU23-11853. doi:10.5194/egusphere-egu23-11853
- PTI, GSI plans to use AI to develop robust landslide forecasting model: DG, The Week, 20 July 2025. theweek.in
- PTI, Union coal minister to inaugurate 175th foundation day celebrations of GSI on March 4, The Week, 27 February 2025. theweek.in
- Amrita Vishwa Vidyapeetham, WINSOC network, Munnar, Idukki (project page). amrita.edu