
Snow and glacier melt: how winter shapes Himalayan rivers
Where the water in the Indus, Ganga and Brahmaputra comes from, why snowmelt and glacier melt arrive at different times, what 'peak water' means, and what all of it asks of a river gauge.

In December the Chenab, the Satluj and the Beas run low, and hydropower and irrigation engineers are working with whatever the river still carries. Yet by April these rivers are rising again, well before the monsoon. That water comes from the winter itself: snow on the high ranges and ice stored in glaciers for decades. This article explains where Himalayan river flow comes from, why the answer depends on the basin and on how far downstream you stand, what "peak water" means, and what melt-fed rivers ask of the people who measure them.
Four sources of water
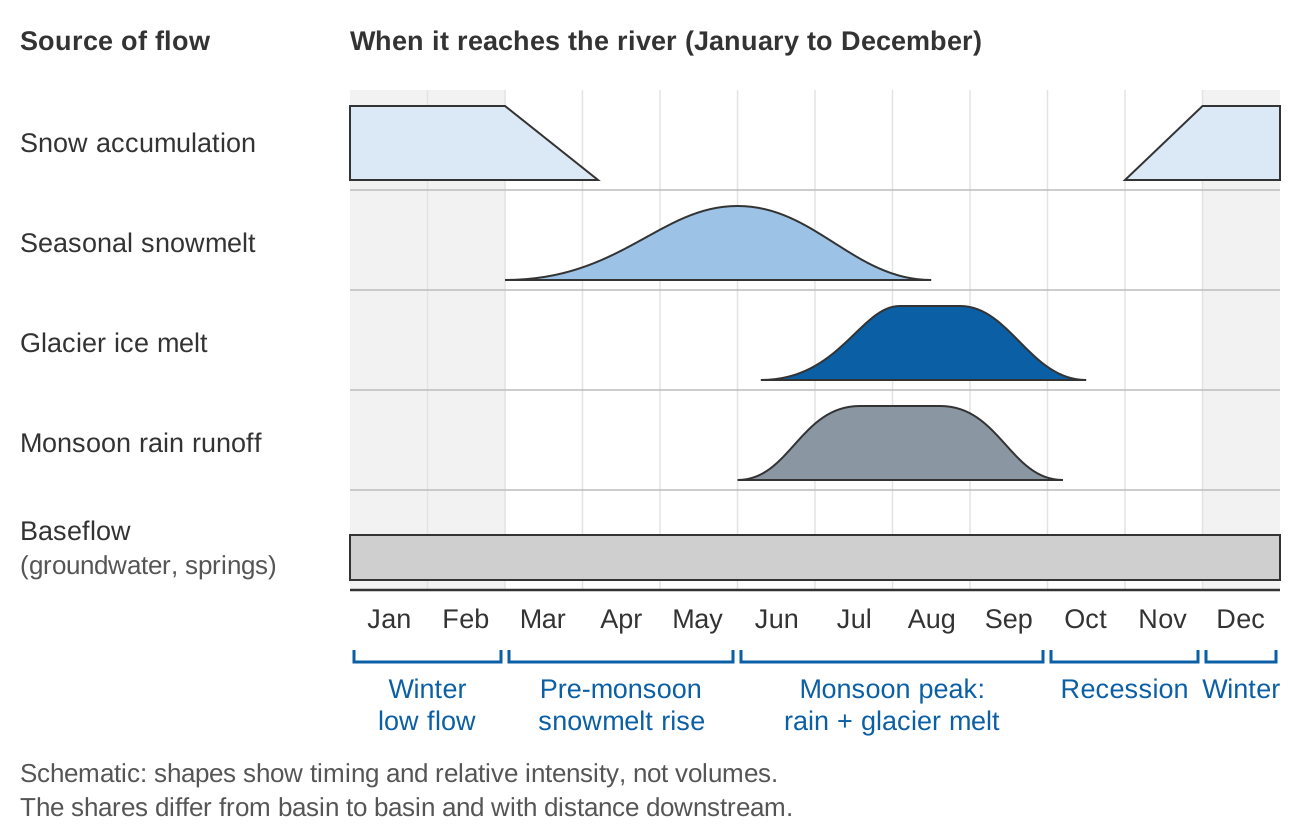
The flow at any point on a Himalayan river is a mix of four components, which hydrological models and field studies try to separate:
- Rainfall runoff: rain that reaches the channel within days, mostly during the summer monsoon (June to September).
- Seasonal snowmelt: snow that falls in winter, largely from western disturbances in the western Himalaya, and melts in spring and early summer.
- Glacier melt (ice melt): melting of glacier ice that has been stored for many years.
- Baseflow: water that has infiltrated into soils, fractured rock and springs and seeps out slowly. Baseflow is what keeps a river running in the dry months.
A hydrological regime is the typical pattern of flow through the year that results from this mix. In the western Himalaya the regime has a long, low winter, a rise in spring and a large peak in July and August [6].
Snowmelt and glacier melt are not the same thing
Both are "meltwater", but they behave very differently, and confusing them causes many of the misunderstandings in public debate.
| Seasonal snowmelt | Glacier melt | |
|---|---|---|
| Where the water was stored | Snowpack from the most recent winter | Glacier ice built up over decades or centuries |
| When it reaches the river | Spring and early summer, as the snowline climbs | Mid to late summer, once the seasonal snow has melted off the glacier |
| What controls the volume | Last winter's snowfall, then spring temperature | Summer temperature and the area of exposed ice |
| Renewable each year? | Yes, if winter snowfall continues | Only as fast as snowfall rebuilds the glacier; otherwise it is drawn from storage |
On the Satluj, glacier melt runoff in July, August and September arrives after the seasonal snowmelt, once glaciers become snow free [6]. Bare ice also melts faster than snow for the same warmth, because snow reflects more sunlight (it has a higher albedo) [9]. Snow is a seasonal store that is refilled every winter; a glacier is a long-term store that a warming climate can draw down.
The flow regime in numbers: Chenab at Akhnoor
The chart below shows the mean monthly discharge of the Chenab at Akhnoor in Jammu, compiled from UNESCO records in the RivDIS global discharge database [10], averaged over the eleven years with complete records between 1968 and 1979.
Three things stand out:
- The winter flow is small. December to February together carry only about 6 % of the sum of the monthly means, and January's mean flow (166 m³/s) is about one-thirteenth of July's (2,135 m³/s).
- The rise starts long before the monsoon. Flow more than doubles from March (372 m³/s) to May (886 m³/s). On the neighbouring Satluj, flow from March to June comes mainly from snowmelt at the higher elevations [6], and the Chenab's spring rise has the same timing.
- June to September carries about 70 % of the year's flow, when melt and monsoon rain act together.
How much comes from melt? It depends where you stand
The most important rule for reading published figures is that the share of meltwater depends on the basin, on how far downstream the measurement point is, and on the method used. Always ask which station, which period and which method.
Across the three great basins
Comparing five Asian basins, Immerzeel and colleagues found meltwater "extremely important" in the Indus, important for the Brahmaputra, and modest for the Ganges [1]. Lutz et al. modelled the upstream basins for 1998–2007 [2]:
- In the upper Indus, glacier melt contributes 40.6 % of total runoff.
- In the upper Ganga, only 11.5 %, despite a larger relative glacier area, because the monsoon makes the regime rain-dominated.
- The upper Brahmaputra is comparable to the Ganga, with slightly larger glacier and snowmelt shares.
- Baseflow makes up 11 % (upper Indus) to 23 % (upper Mekong) of total flow.
The Hindu Kush Himalaya Assessment sums up: melt matters most in western rivers such as the Indus, least in the Ganga and Brahmaputra, and more with altitude and closeness to glaciers and snow [5].
One river, several answers: the Satluj at Bhakra
| Study | Method | Period | Snow + glacier melt | Rain | Baseflow |
|---|---|---|---|---|---|
| Singh and Jain (2002) [7] | Water balance | Oct 1986 – Sep 1996 | about 59 % | about 41 % | not separated |
| Lutz et al. (2014), as tabulated in [5] | Glacio-hydrological model | 1998–2007 | 48.4 % (27.6 % glacier, 20.8 % snow) | 38.6 % | 13 % |
| Wulf, Bookhagen and Scherler (2016) [11] | Distributed model with remote sensing | 2000–2012 | 45 % (10 % glacier, 35 % snow) | 55 % (effective rainfall) | not separated |
The studies differ in definitions (two do not separate baseflow), data and years, but agree that roughly half of the Satluj's annual flow at Bhakra comes from snow and ice.
Further downstream, less melt
On the Beas, an isotope study at Manali, high in the valley, found that snow and glacier melt made up about 50 % of the flow in 2010–2011 (52 % from a snowmelt model) [12]. A water-balance study at Pandoh Dam, much further downstream, estimated about 35 % for 1990–2004 [13]. Along the Satluj, the glacier melt contribution falls from about 30 % in the high interior to about 10 % at the mountain front [11]. Towards the mountain front, effective rainfall becomes the dominant source [11].
Why the winter and pre-monsoon months matter
- Irrigation and hydropower. Snowmelt-dominated flow in the dry pre-monsoon spring meets irrigation and hydropower needs in northern India; the Bhakra reservoir, fed by the Satluj and water diverted from the Beas, is a lifeline for water supply in three states [6]. Continued glacier shrinkage outside the Karakoram will increase the seasonality of runoff and affect irrigation and hydropower [4].
- Drinking water and springs. Springs are the primary water source for rural households across the Hindu Kush Himalaya and help maintain winter and dry-season flows; about 80 % of rural households in Sikkim rely on spring water [5].
- A buffer in dry years. In the Satluj, glacier melt supplied 17.3 % of the flow in 2004, a year when total discharge was only half of the maximum, compensating for reduced rainfall and snowmelt [11]. Measurements in a small Garhwal catchment found that the glacier share of flow is highest in the years of lowest summer runoff [14].
- Melt in floods, too. In our analysis of the July 2023 floods in Himachal Pradesh, extremely heavy rainfall combined with near-saturated soils and snowmelt inflated and sustained the flood peak [15].
Peak water: more melt now, less later
A shrinking glacier first releases more water, as warmer temperatures draw down long-term storage. Eventually the smaller ice area can no longer sustain rising melt, and glacier runoff declines. The year of maximum annual glacier runoff is called peak water [3].
Huss and Hock (2018) modelled 56 large glacier-fed basins worldwide for 1980–2100 [3]. In about 45 % of them, peak water had already been reached (as of 2017). In most basins fed by High Mountain Asia glaciers, annual glacier runoff is projected to rise until roughly mid-century and then decline. There is large variation within basins: peak water around 2070 in parts of the Indus headwaters, around mid-century in most Ganga headwaters, and already passed or close in the interior headwaters of the Brahmaputra. Their basin-scale results, with uncertainties, are:
| Basin | Peak water, RCP2.6 | RCP4.5 | RCP8.5 | Rise in glacier runoff to peak (RCP4.5) |
|---|---|---|---|---|
| Indus | 2029 ± 10 | 2045 ± 17 | 2064 ± 19 | +32 % |
| Ganga | 2028 ± 19 | 2044 ± 21 | 2053 ± 32 | +19 % |
| Brahmaputra | 2030 ± 18 | 2049 ± 18 | 2049 ± 30 | +16 % |
RCP: emission scenarios from low (2.6) to high (8.5). Rise relative to 1980–2000. Source: [3], Supplementary Table 3.
Two points are easy to miss. First, this is glacier runoff, not total river flow; most of these basins have only a small fraction of their area under ice. Second, the change is felt most in particular months: in the Indus, the largest relative reductions in basin runoff due to glacier loss are projected for September or October, when low basin flow coincides with the glacier melt maximum [3].
What the projections say for total flow
Lutz et al. projected more runoff in the upper basins at least until 2050 [2]. For 2041–2050 under RCP4.5, upper Indus runoff rises 7–12 % in three of four climate models (the dry, warm one gives −5 %), driven by accelerated melt; upper Ganga runoff rises up to 10 % (27 % under RCP8.5), driven by more precipitation. Precipitation projections for the upper Indus disagree even in sign, so its long-term picture is highly uncertain [2]. Bolch et al. judged it unlikely that dramatic changes in total runoff will occur soon [4]. In the Beas basin, our regional climate modelling showed stark differences in hydrological impacts between emission scenarios [16], which is why projections should be read as ranges, not single numbers.
The expected direction is clearer than the size [8]: more rain instead of snow, earlier snowmelt, glacier contributions that rise and then fall, and more exposure to both extreme runoff and prolonged low flows.
How melt is estimated: the degree-day method
Many of the studies above, including [2], simulate snow and glacier melt with a degree-day model, which assumes that melt is proportional to the sum of positive air temperatures [9]:
M = DDF × Σ T+

M    = melt over the period (mm of water)
DDF  = degree-day factor (mm per °C per day)
T+   = mean daily air temperature above 0 °C (days below 0 °C count as zero)
Measured degree-day factors vary widely. At Dokriani Glacier in the Garhwal Himalaya they were 5.7 mm/°C/day for snow and 7.4 for ice, and 16.9 for ice on Khumbu Glacier in Nepal [9]. Try the calculator below.
Illustrative calculator. Default values show the worked example below.
Worked example (illustrative). A 10 km² tongue of bare glacier ice, at a daily mean temperature of 5 °C and a degree-day factor of 7.4 mm/°C/day, melts 7.4 × 5 = 37 mm of water in a day. That is 0.037 m × 10,000,000 m² = 370,000 m³, or 370,000 ÷ 86,400 ≈ 4.3 m³/s averaged over the day. With the snow factor of 5.7, the same area and temperature give 28.5 mm and about 3.3 m³/s.
Degree-day models work well over long periods but lose accuracy at short time steps, and a daily mean below freezing can hide melting that happened during the warm part of the day [9].
What melt-fed rivers mean for river monitoring
A daily cycle in the water level
Melt follows the sun, so a melt-fed stream rises and falls every day. Near the snout of Dokriani Glacier, the lowest flow was observed at 07:00 and the highest at 18:00, with the maximum about 1.8 times the minimum [17]. For monitoring this means:
- A once-a-day manual reading at a fixed hour can be biased high or low depending on when it is taken relative to the daily wave. Continuous recording at intervals of an hour or less captures the cycle.
- A daily rise and fall in spring and summer, without rain, is real signal, not noise. See what a hydrograph tells you for reading these patterns.
Ice and frozen gauges
At high stations, ice in the channel can raise the water level without any change in flow. The stage reading may be correct, but the stage-discharge relation no longer applies, so discharge computed from the open-water rating is wrong. Discharge for those periods has to be estimated afterwards from winter field measurements, weather records and comparison with stations not affected by ice [18]. Freezing of small upstream channels at night can also produce a daily drop in flow at the gauge that is real, not an error [18].
Low-flow ratings
Winter discharge depends on the part of the rating curve where the depth over the control is smallest, and there a small error in stage becomes a large error in discharge. For a rating Q = C (h − h0)^b, the relative error is approximately:
ΔQ / Q ≈ b × Δh / (h − h0)Illustrative example: with b = 1.7 and a 1 cm stage error, the discharge error is 1.7 × 0.01 / 0.25 ≈ 7 % when the depth over the control is 0.25 m in winter, but only 1.7 × 0.01 / 2.0 ≈ 0.9 % at a monsoon depth of 2 m. Where the control is gravel or boulders that move in floods, check the low-flow end of the rating with fresh gaugings after each monsoon; see rating curves and their uncertainty. The Hindu Kush Himalaya Assessment notes that discharge measurements in remote mountain areas are prone to errors from the sensor, the river and the rating curve, and that no systematic evaluation of rating curves had yet been made in the region [8].
Long records in the right places
Detecting a change in melt timing needs long, consistent records at several altitudes, because year-to-year variability can exceed any climate signal [8]. For the practical side of siting and running such stations, see river monitoring in hill and Himalayan catchments.
Key points
- Flow comes from rain, snowmelt, glacier melt and baseflow; the mix differs by basin, by distance downstream and by estimation method.
- Meltwater is very important in the Indus, less so in the Ganga and Brahmaputra, where monsoon rain dominates [1][2][5].
- Snowmelt drives the pre-monsoon rise; glacier melt arrives in mid to late summer; baseflow carries the winter.
- Peak water for glacier runoff in the Indus, Ganga and Brahmaputra is projected mostly around mid-century, with wide uncertainty and large differences between headwaters [3].
- Record continuously to capture daily melt cycles, treat ice-affected discharges with care, and gauge low flows regularly.
Where ClimMaTech fits
At ClimMaTech we work on monitoring rivers in the Himalaya, where melt, rain and changing channels all show up in the record. You can read about our approach on the river monitoring page.
References
- W. W. Immerzeel, L. P. H. van Beek, M. F. P. Bierkens, Climate change will affect the Asian water towers, Science 328 (2010), 1382–1385. doi:10.1126/science.1183188
- A. F. Lutz, W. W. Immerzeel, A. B. Shrestha, M. F. P. Bierkens, Consistent increase in High Asia's runoff due to increasing glacier melt and precipitation, Nature Climate Change 4 (2014), 587–592. doi:10.1038/nclimate2237
- M. Huss, R. Hock, Global-scale hydrological response to future glacier mass loss, Nature Climate Change 8 (2018), 135–140, including Supplementary Table 3. doi:10.1038/s41558-017-0049-x
- T. Bolch et al., The state and fate of Himalayan glaciers, Science 336 (2012), 310–314. doi:10.1126/science.1215828
- C. A. Scott et al., Water in the Hindu Kush Himalaya, Chapter 8 in P. Wester, A. Mishra, A. Mukherji, A. B. Shrestha (eds.), The Hindu Kush Himalaya Assessment, ICIMOD and Springer, 2019 (open access). doi:10.1007/978-3-319-92288-1_8
- I. Pal, U. Lall, A. W. Robertson, M. A. Cane, Predictability of Western Himalayan river flow: melt seasonal inflow into Bhakra Reservoir in northern India, Hydrology and Earth System Sciences 17 (2013), 2131–2146. hess.copernicus.org
- P. Singh, S. K. Jain, Snow and glacier melt in the Satluj River at Bhakra Dam in the western Himalayan region, Hydrological Sciences Journal 47(1) (2002), 93–106. doi:10.1080/02626660209492910
- T. Bolch et al., Status and change of the cryosphere in the extended Hindu Kush Himalaya region, Chapter 7 in P. Wester et al. (eds.), The Hindu Kush Himalaya Assessment, ICIMOD and Springer, 2019 (open access). doi:10.1007/978-3-319-92288-1_7
- R. Hock, Temperature index melt modelling in mountain areas, Journal of Hydrology 282 (2003), 104–115. doi:10.1016/S0022-1694(03)00257-900257-9)
- C. J. Vörösmarty, B. M. Fekete, B. A. Tucker, Monthly mean river discharge at gauging station Akhnoor (RivDIS, Global River Discharge 1807–1991, v1.1), PANGAEA, 2004, CC BY 3.0. doi:10.1594/PANGAEA.218300
- H. Wulf, B. Bookhagen, D. Scherler, Differentiating between rain, snow, and glacier contributions to river discharge in the western Himalaya using remote-sensing data and distributed hydrological modeling, Advances in Water Resources 88 (2016), 152–169. doi:10.1016/j.advwatres.2015.12.004
- R. S. Ahluwalia, S. P. Rai, S. K. Jain, B. Kumar, D. P. Dobhal, Assessment of snowmelt runoff modelling and isotope analysis: a case study from the western Himalaya, India, Annals of Glaciology 54(62) (2013), 299–304. doi:10.3189/2013AoG62A133
- V. Kumar, P. Singh, V. Singh, Snow and glacier melt contribution in the Beas River at Pandoh Dam, Himachal Pradesh, India, Hydrological Sciences Journal 52(2) (2007), 376–388. doi:10.1623/hysj.52.2.376
- R. J. Thayyen, J. T. Gergan, Role of glaciers in watershed hydrology: a preliminary study of a "Himalayan catchment", The Cryosphere 4 (2010), 115–128. tc.copernicus.org
- V. Gupta, B. Syed, A. Pathania, S. Raaj, A. Nanda, S. Awasthi, D. P. Shukla, Hydrometeorological analysis of July-2023 floods in Himachal Pradesh, India, Natural Hazards 120 (2024), 7549–7574. doi:10.1007/s11069-024-06520-5
- S. Barbhuiya, S. Sharma, A. Pathania, V. Gupta, Assessing the impacts of climate change on hydroclimatic regimes in Beas River Basin, in Navigating the Nexus, Water Science and Technology Library, Springer, 2025, 325–350. doi:10.1007/978-3-031-76532-2_14
- P. Singh, K. S. Ramasastri, U. K. Singh, J. T. Gergan, D. P. Dobhal, Hydrological characteristics of the Dokriani Glacier in the Garhwal Himalayas, Hydrological Sciences Journal 40(2) (1995), 243–257. doi:10.1080/02626669509491407
- U.S. Geological Survey, Maryland-Delaware-District of Columbia Water Science Center, Ice effects on streams. md.water.usgs.gov