
Western disturbances: winter precipitation in the Himalaya
What the weather systems behind Himalayan winter snow are, where they come from, how much water they bring, how they turn dangerous, and what is known about how they are changing.

Most of India waits for the monsoon. The western Himalaya also waits for winter. In Srinagar and Gulmarg, the wettest months of the year come between January and April. The weather systems that bring this winter snow and rain are western disturbances (WDs). They feature in IMD bulletins all through the winter, and they are behind some of the region's worst disasters.
What a western disturbance is
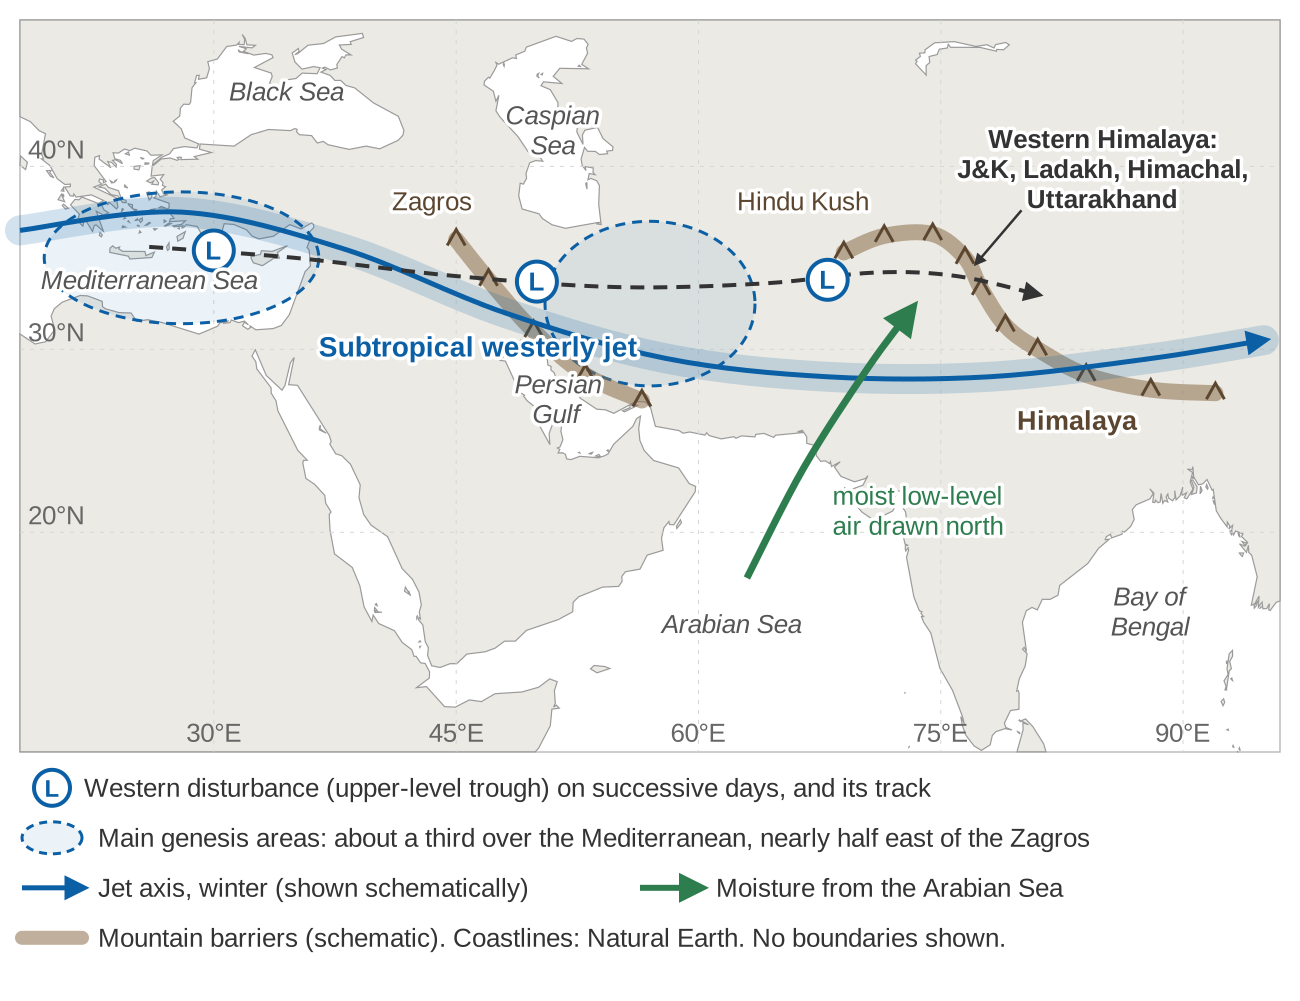
A western disturbance is a synoptic-scale weather system (a few hundred to a few thousand kilometres across, lasting days) embedded in the subtropical westerly jet, a narrow band of strong westerly winds in the upper troposphere [1][2]. At its core is an upper-level trough: a dip in the westerly flow where pressure is lower and the air turns cyclonically (anticlockwise, in the northern hemisphere). Tracking studies place the strongest spin, or vorticity, between about 450 and 250 hPa, roughly 6 to 10 km above sea level [1]. A WD is often accompanied by a low or an "induced cyclonic circulation" in the lower atmosphere [1][3].
A composite of more than 3,000 tracked WDs shows a system that tilts north-westward with height, with strong rising air ahead of its centre, above the area of heaviest surface precipitation [4]. IMD bulletins use the same language. On 1 February 2024, for example, IMD reported "a Western Disturbance as a trough in middle tropospheric westerlies" running roughly along 72°E, north of 30°N, with an induced cyclonic circulation over north-west Rajasthan [3]. Winter precipitation from WDs is sometimes called the Indian winter monsoon [5].
Where they come from and how they travel
IMD's definition says that WDs originate over the Mediterranean, Caspian and Black Seas [1]. Modern tracking with reanalysis data (gridded reconstructions of past weather) gives a more mixed picture. Only about a third of WDs spin up over the Mediterranean, and nearly half form east of the Zagros mountains in Iran, one to two WD wavelengths upstream of the western Himalaya [1].
Early studies found that WDs move east at 6 to 12 m/s and last 2 to 12 days [1]. Their path is set by the jet: years with more WDs over north India have a jet that lies further south [4], and the jet associated with "active" winter WDs averages about 60 m/s [1]. WDs reach peak intensity about a day before their centre passes over the mountains [1].
Worked example: how long does a WD take to arrive?
Distance along a parallel of latitude is Δlon × 111.32 km × cos(latitude). At 33°N, one degree of longitude is about 93.4 km. Taking the target as 77°E (Himachal Pradesh) and the speed range of 6 to 12 m/s from [1], that is 518 to 1,037 km per day:
| Starting point | Distance to 77°E | Days at 6 m/s | Days at 12 m/s |
|---|---|---|---|
| Eastern Mediterranean, 35°E | 42° × 93.4 = 3,920 km | 7.6 | 3.8 |
| Central Iran, 55°E | 22° × 93.4 = 2,050 km | 4.0 | 2.0 |
The example is illustrative, since real WDs change speed and many form close to India. It shows why a WD is usually visible on weather charts days before it brings snow to the Himalaya, and because the rising air lies ahead of the centre [4], precipitation can begin before the trough arrives.
What happens when one meets the mountains
How much a WD delivers depends on the moisture it can draw in and the terrain it meets. In winter, the moisture for extreme precipitation events in north India and Pakistan comes mostly from the Arabian Sea [6]. Over the Himalayan foothills, low-level southerly moisture transport explains about 80 % of the variance of winter precipitation [1]. The moist air is forced up the slopes, cools and condenses. This orographic (terrain-forced) lifting is why WD precipitation is "further enhanced over the Himalayas" [2].
Elevation matters for extremes generally. In our study of precipitation extremes across India, most extreme-precipitation indices showed a positive and statistically significant correlation with land surface elevation above 1,500 m [7].
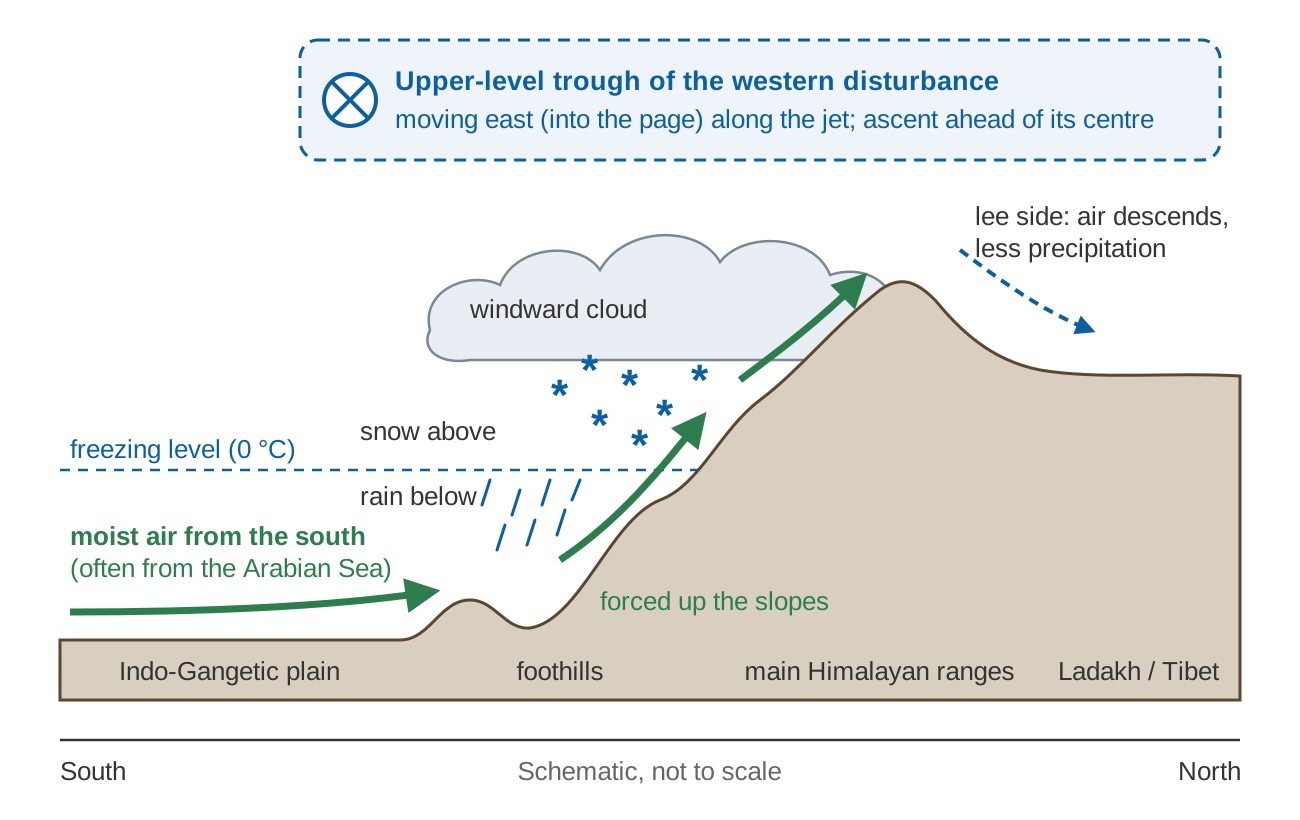
WDs bring more than rain and snow. A 2025 review lists heavy snowfall, hailstorms, fog, cloudbursts, avalanches, frost and cold waves among their hazards, and attributes to WDs about half of winter fog events over north India and 93 % of lightning strikes in the western Himalaya [1].
How often they come
WDs are most common from December to March, when they are nearly ten times more frequent than in July and August [1]. How many there are depends on who counts and how:
| Source | Region and period | Count |
|---|---|---|
| Rao and Srinivasan (1969), cited in [1][8] | Western Himalaya, winter | about 6–7 per month |
| IMD daily weather reports, analysed in [5] | Indian region, 1986–2016 | about 500 in total |
| Objective tracking [4] | Reanalysis, 37 years, all seasons | over 3,000 in total |
| Reanalysis mean in [9] | Winter | 26 per winter |
| Kumar et al. [8] | Himachal Pradesh, Dec–Mar 1977–2007, WDs that gave precipitation | mean 12 per winter, at most 4 a month (Feb and Mar) |
| Ahmed et al. [10] | Jammu & Kashmir, Nov–Apr 1980–2019, moderate to severe | 600 in total; about 2 a month in Nov–Dec, 3 a month in Jan–Apr |
The numbers differ by a factor of several because studies use different definitions (any upper-level trough, or only those that cause precipitation), regions and data [1].
How much precipitation they bring
The western Himalaya receives a little less than half of its annual precipitation in the winter months, and the Hindu Kush up to 80 % [1]. Across northern India as a whole, about one-third of annual precipitation falls in winter [5]. Estimates of the WD share of winter precipitation vary with method: about 55 % over the western Himalaya and surrounding region in one tracking study, and over 80 % of December–March precipitation falling on days with a WD in another [1]. In the Karakoram, WDs supply about 65 % of seasonal snowfall [11].
IMD station normals show what this looks like on the ground.
Summing the normals by season:
| Station | December–April | June–September | Annual |
|---|---|---|---|
| Srinagar | 27.2 + 63.6 + 85.0 + 104.6 + 91.8 = 372.2 mm (53 %) | 46.4 + 64.0 + 64.5 + 37.4 = 212.3 mm (30 %) | 697.5 mm |
| Gulmarg | 74.1 + 161.3 + 207.5 + 215.6 + 166.2 = 824.7 mm (57 %) | 101.6 + 101.7 + 101.0 + 75.9 = 380.2 mm (26 %) | 1,449.2 mm |
Not every millimetre between December and April comes from WDs, but the winter-spring peak is their signature. The balance differs from station to station, so always look at the normals for the place you work in.
Snowpack, rivers and rabi crops
During December, January and February, WD snowfall is the dominant precipitation input that builds and sustains the regional snowpack, and spring melt is the major source of runoff to north Indian rivers [2]. An isotopic analysis estimated that 70 % of the water discharged by the Indus comes from precipitation associated with WDs. Spring snowmelt contributes up to 40 % of Indus discharge and up to 20 % of Ganges discharge, and this meltwater helps ease the seasonal drought of May and June [1]. For how melt shapes a river's year, see snow and glacier melt: how winter shapes Himalayan river flow.
On the plains and in the valleys, WD rain supports the rabi (winter-sown) crops such as wheat and barley. A winter with few WDs is felt on farms: the review cites low rainfall in late 2015 that hampered crops, linked to an anomalously low frequency of WDs [1].
When western disturbances turn dangerous
Snow, avalanches, landslides and flash floods
In Himachal Pradesh, WD precipitation sometimes comes with heavy snowfall and extensive avalanches [8], and isolated WD extremes can cause devastating flash flooding [9]. Systematic evidence for avalanches is thin: the review finds the links largely anecdotal [1]. It is clearer for landslides: of 327 landslides in the Upper Indus Basin, 61 % were associated with the passage of a WD [1]. On 18 October 2021, a WD led to heavy flooding in Uttarakhand that killed 57 people [1]. Why warning time is so short in such events is discussed in flash floods vs river floods.
June 2013: a western disturbance meets the monsoon
The Kedarnath disaster of June 2013 is the best-known case of a WD interacting with the monsoon. The monsoon advanced unusually fast that year. After a normal onset on 1 June it covered the whole country by 16 June, against a normal date of around 15 July, the fastest advance in the 1941–2013 record. Uttarakhand's June rainfall was 191 % above normal [13].
A low-pressure area formed over the north-west Bay of Bengal on 12 June and moved west-north-west across central India. A western disturbance lay as a trough in the mid-level westerlies over north Pakistan on 15 June. Moisture came in from both the Arabian Sea and the Bay of Bengal, and the orography of the western Himalaya enhanced the lifting [14][15]. In one analysis, the monsoon low produced strong low-level convergence and a constant supply of moisture, while the southward intrusion of the mid-latitude westerly trough provided strong upper-level divergence [14].
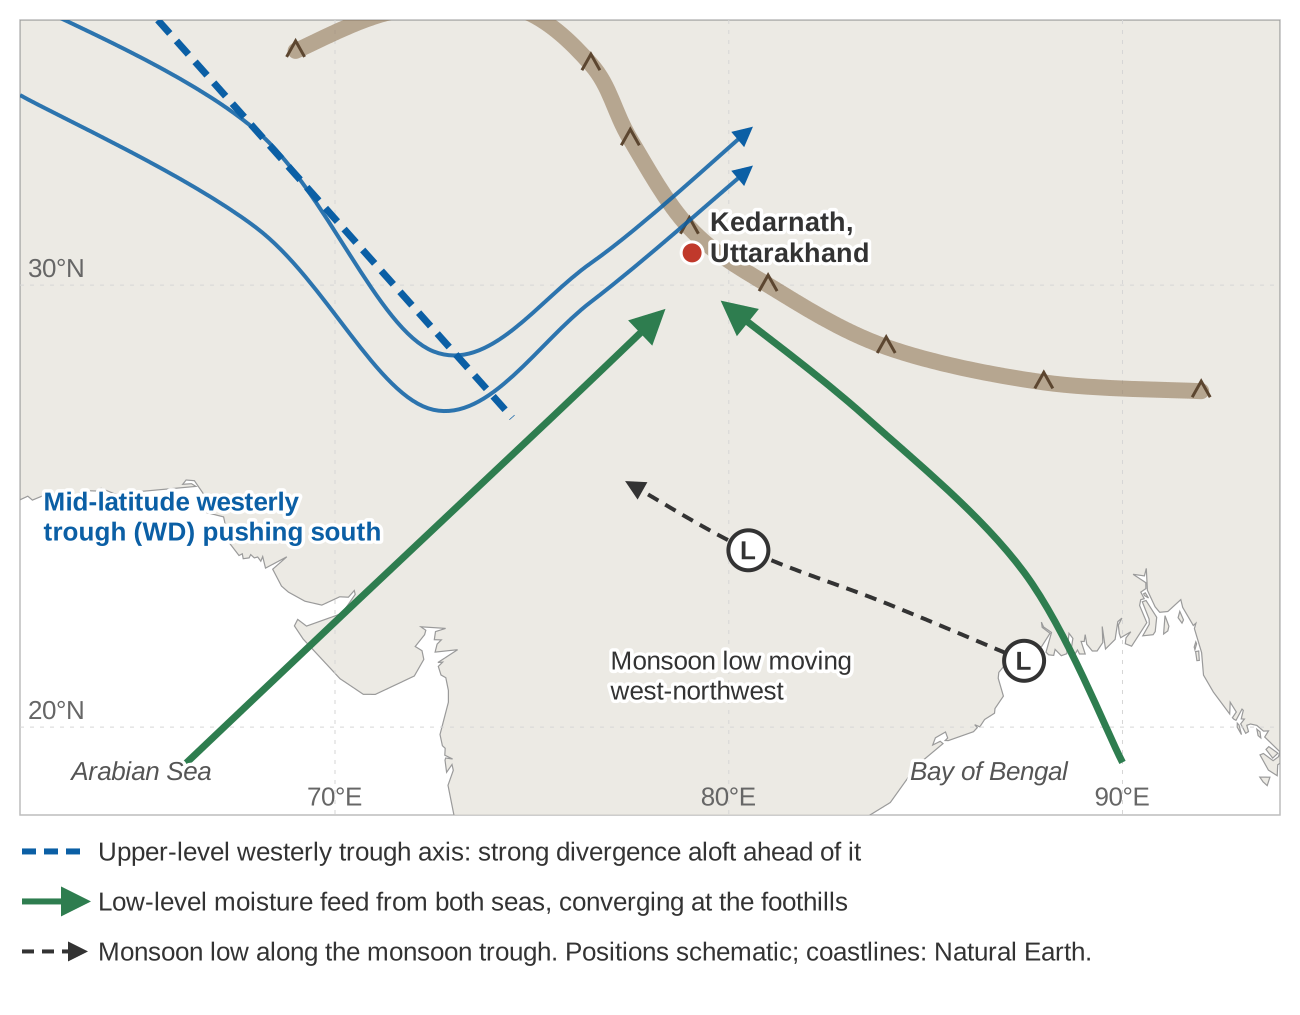
On 17 June, Uttarakhand received more than 340 mm of rainfall, against a daily normal of 65.9 mm during the monsoon [16]. That morning the glacial lake Chorabari Tal breached and devastated the temple township of Kedarnath. The National Institute of Disaster Management reported 680 deaths and 4,117 people missing [15].
June 2013 was not a one-off. An analysis of 34 extreme precipitation events in the western Himalaya from 1979 to 2013 found a common large-scale pattern: a deep, southward-penetrating mid-latitude westerly trough, a blocking high over western Eurasia and an intensifying Tibetan anticyclone, with monsoon lows moving west-north-west from the Bay of Bengal among the key elements [17]. Of 59 WD–tropical depression interactions from 1979 to 2015, most occurred after the monsoon, with a smaller peak in May and June, and precipitation was heaviest when the two systems became dynamically coupled [18]. The September 2014 Kashmir floods were also caused by a WD interacting with an active monsoon trough [1].
The floods of July 2023 in north India have been linked to a WD that arrived during the monsoon [19]. In our analysis of the 7–11 July 2023 floods in Himachal Pradesh, the flood peak was inflated and sustained by extremely heavy rainfall falling on near-saturated soils, together with snowmelt [20]. The atmosphere sets up the event, but the state of the catchment decides how big the flood becomes.
Are western disturbances changing?
It depends on where, when and how you look. A 2024 study that compared 17 earlier studies found no consensus on trends in WD frequency, partly because they covered different regions, seasons and periods. Using a consistent 70-year track catalogue, the same study found [19]:
- winter WDs have increased significantly over the western and central Himalaya and the Hindu Kush, attributed to a strengthening subtropical jet;
- the season has lengthened, and WDs have been twice as common in June in the last twenty years as in the previous fifty, attributed to a later northward retreat of the jet;
- there is no significant trend in the intensity of winter WDs [1].
Regional station studies give a different picture over shorter periods. Over Himachal Pradesh in 1977–2007, WD frequency showed a significant decreasing trend, with total winter precipitation down about 13 % and heavy precipitation days down about 25 % relative to their means [8]. In Jammu & Kashmir in 1980–2019, trends differed by month, with significant decreases in November and March and an increase in February [10]. In the Karakoram, WD frequency has stayed steady while the precipitation intensity associated with WDs has risen by about 10 % [11]. The 2025 review's overall judgement is "medium confidence" that there is no clear trend in WD frequency or intensity over the instrumental period [1].
For the future, CMIP5 climate models project WD frequency falling by about 15 % by the end of the century under a high-emissions scenario, with mean winter rainfall over Pakistan and northern India down by about 15 % [21]. The review rates confidence in such a decline as very low [1]. For planners, long, well-kept local records matter more than any headline trend.
How IMD forecasts and reports them
IMD reports WDs in its bulletins and weekly extended-range forecasts, giving each system's position and expected effect. Its press release of 1 February 2024 shows the format: the season's first active WD had affected north-west India only from 28 January, another was forecast from 3 February, and no active WD was expected in the week after [3]. On 29 February 2024 it reported three WDs crossing extreme northern India in one week "with limited impact". For the winter season, 1 January to 28 February, it gave a rainfall departure of −32 % for the country as a whole against the long period average (the climatological mean) [22].
The 2025 review finds short-range risk forecasts generally accurate up to 3–4 days ahead, even in complex terrain, with warnings that tend to escalate as an event approaches. Extended-range forecasts have captured regional precipitation anomalies up to three weeks ahead in one study, but confidence in forecasting individual WD tracks remains very low [1].
For a district office or a dam operator, a named WD in the bulletin a few days out is a cue to check what is exposed: snow-bound roads, avalanche-prone stretches, landslide-prone slopes, and rivers in catchments where heavy rain is forecast. Seeing how those rivers respond depends on stations that keep working through the winter, as discussed in river monitoring in hill and Himalayan catchments.
Key points
- Western disturbances are upper-level troughs carried east by the subtropical westerly jet. Many form east of the Zagros as well as over the Mediterranean, and they reach the Himalaya in a few days.
- Moisture, mostly from the Arabian Sea in winter, and lifting over the mountains turn a WD into heavy snow and rain over J&K, Ladakh, Himachal and Uttarakhand.
- In the far western Himalaya, January to April is the wet season: Srinagar and Gulmarg both peak in March.
- WD snow builds the snowpack that feeds spring and summer river flow, and WD rain supports rabi crops.
- When a WD meets a monsoon system, as in June 2013 and September 2014, the result can be catastrophic.
- Trends depend on region, season and method. A 70-year analysis finds more winter and June WDs, while several regional station studies found declines.
Where ClimMaTech fits
At ClimMaTech we work on monitoring rivers and rainfall in the Himalaya, where western disturbances and the monsoon both shape what the gauges record. You can read about our approach on the river monitoring and flood warning pages.
References
- K. M. R. Hunt, J.-P. Baudouin, A. G. Turner, A. P. Dimri, G. Jeelani, Pooja, R. Chattopadhyay, F. Cannon, T. Arulalan, M. S. Shekhar, T. P. Sabin, E. Palazzi, Western disturbances and climate variability: a review of recent developments, Weather and Climate Dynamics 6, 43–112, 2025. doi:10.5194/wcd-6-43-2025
- A. P. Dimri, D. Niyogi, A. P. Barros, J. Ridley, U. C. Mohanty, T. Yasunari, D. R. Sikka, Western Disturbances: A review, Reviews of Geophysics 53(2), 225–246, 2015. doi:10.1002/2014RG000460
- India Meteorological Department, Current weather status and extended range forecast for next two weeks, press release, 1 February 2024. internal.imd.gov.in
- K. M. R. Hunt, A. G. Turner, L. C. Shaffrey, The evolution, seasonality and impacts of western disturbances, Quarterly Journal of the Royal Meteorological Society 144(710), 278–290, 2018. doi:10.1002/qj.3200
- T. M. Midhuna, P. Kumar, A. P. Dimri, A new Western Disturbance Index for the Indian winter monsoon, Journal of Earth System Science 129, 59, 2020. doi:10.1007/s12040-019-1324-1
- K. M. R. Hunt, A. G. Turner, L. C. Shaffrey, Extreme daily rainfall in Pakistan and north India: scale interactions, mechanisms, and precursors, Monthly Weather Review 146(4), 1005–1022, 2018. doi:10.1175/MWR-D-17-0258.1
- V. Gupta, M. K. Jain, Impact of ENSO, global warming, and land surface elevation on extreme precipitation in India, Journal of Hydrologic Engineering 25(1), 05019032, 2020. doi:10.1061/(ASCE)HE.1943-5584.0001872HE.1943-5584.0001872)
- N. Kumar, B. P. Yadav, S. Gahlot, M. Singh, Winter frequency of western disturbances and precipitation indices over Himachal Pradesh, India: 1977–2007, Atmósfera 28(1), 63–70, 2015. doi:10.20937/ATM.2015.28.01.06
- K. M. R. Hunt, A. G. Turner, L. C. Shaffrey, Representation of western disturbances in CMIP5 models, Journal of Climate 32(7), 1997–2011, 2019. doi:10.1175/JCLI-D-18-0420.1
- M. Ahmed, B. Das, S. Lotus, M. Ali, A study on frequency of western disturbances and precipitation trends over Jammu & Kashmir, India: 1980–2019, MAUSAM 73(2), 283–294, 2022. doi:10.54302/mausam.v73i2.698
- A. Javed, P. Kumar, K. I. Hodges, D. V. Sein, A. K. Dubey, G. Tiwari, Does the recent revival of western disturbances govern the Karakoram anomaly?, Journal of Climate 35(13), 4383–4402, 2022. doi:10.1175/JCLI-D-21-0129.1
- India Meteorological Department, Meteorological Centre Srinagar, Climatological tables, period 1991–2020: Srinagar and Gulmarg. mausam.imd.gov.in
- D. R. Pattanaik, D. S. Pai, B. Mukhopadhyay, Rapid northward progress of monsoon over India and associated heavy rainfall over Uttarakhand: a diagnostic study and real time extended range forecast, MAUSAM 66(3), 551–568, 2015. doi:10.54302/mausam.v66i3.562
- M. Ranalkar, H. S. Chaudhari, A. Hazra, G. K. Sawaisarje, S. Pokhrel, Dynamical features of incessant heavy rainfall event of June 2013 over Uttarakhand, India, Natural Hazards 80(3), 1579–1601, 2016. doi:10.1007/s11069-015-2040-z
- C. Singh, R. Chand, Exceptionally heavy rainfall over Uttarakhand during 15–18 June, 2013: a case study, MAUSAM 66(4), 741–750, 2015. doi:10.54302/mausam.v66i4.581
- A. Dube, R. Ashrit, A. Ashish, K. Sharma, G. R. Iyengar, E. N. Rajagopal, S. Basu, Forecasting the heavy rainfall during Himalayan flooding—June 2013, Weather and Climate Extremes 4, 22–34, 2014. doi:10.1016/j.wace.2014.03.004
- R. K. Vellore, M. L. Kaplan, R. Krishnan, J. M. Lewis, S. Sabade, N. Deshpande, B. B. Singh, R. K. Madhura, M. V. S. Rama Rao, Monsoon-extratropical circulation interactions in Himalayan extreme rainfall, Climate Dynamics 46, 3517–3546, 2016. doi:10.1007/s00382-015-2784-x
- K. M. R. Hunt, A. G. Turner, R. K. H. Schiemann, How interactions between tropical depressions and western disturbances affect heavy precipitation in South Asia, Monthly Weather Review, 2021. doi:10.1175/MWR-D-20-0373.1
- K. M. R. Hunt, Increasing frequency and lengthening season of western disturbances are linked to increasing strength and delayed northward migration of the subtropical jet, Weather and Climate Dynamics 5, 345–356, 2024. doi:10.5194/wcd-5-345-2024
- V. Gupta, B. Syed, A. Pathania, S. Raaj, A. Nanda, S. Awasthi, D. P. Shukla, Hydrometeorological analysis of July-2023 floods in Himachal Pradesh, India, Natural Hazards 120(8), 7549–7574, 2024. doi:10.1007/s11069-024-06520-5
- K. M. R. Hunt, A. G. Turner, L. C. Shaffrey, Falling trend of western disturbances in future climate simulations, Journal of Climate 32(16), 5037–5051, 2019. doi:10.1175/JCLI-D-18-0601.1
- India Meteorological Department, Current weather status and extended range forecast for next two weeks (29 Feb–13 March), press release, 29 February 2024. internal.imd.gov.in