
India's heavy rain isn't rising everywhere. It's moving.
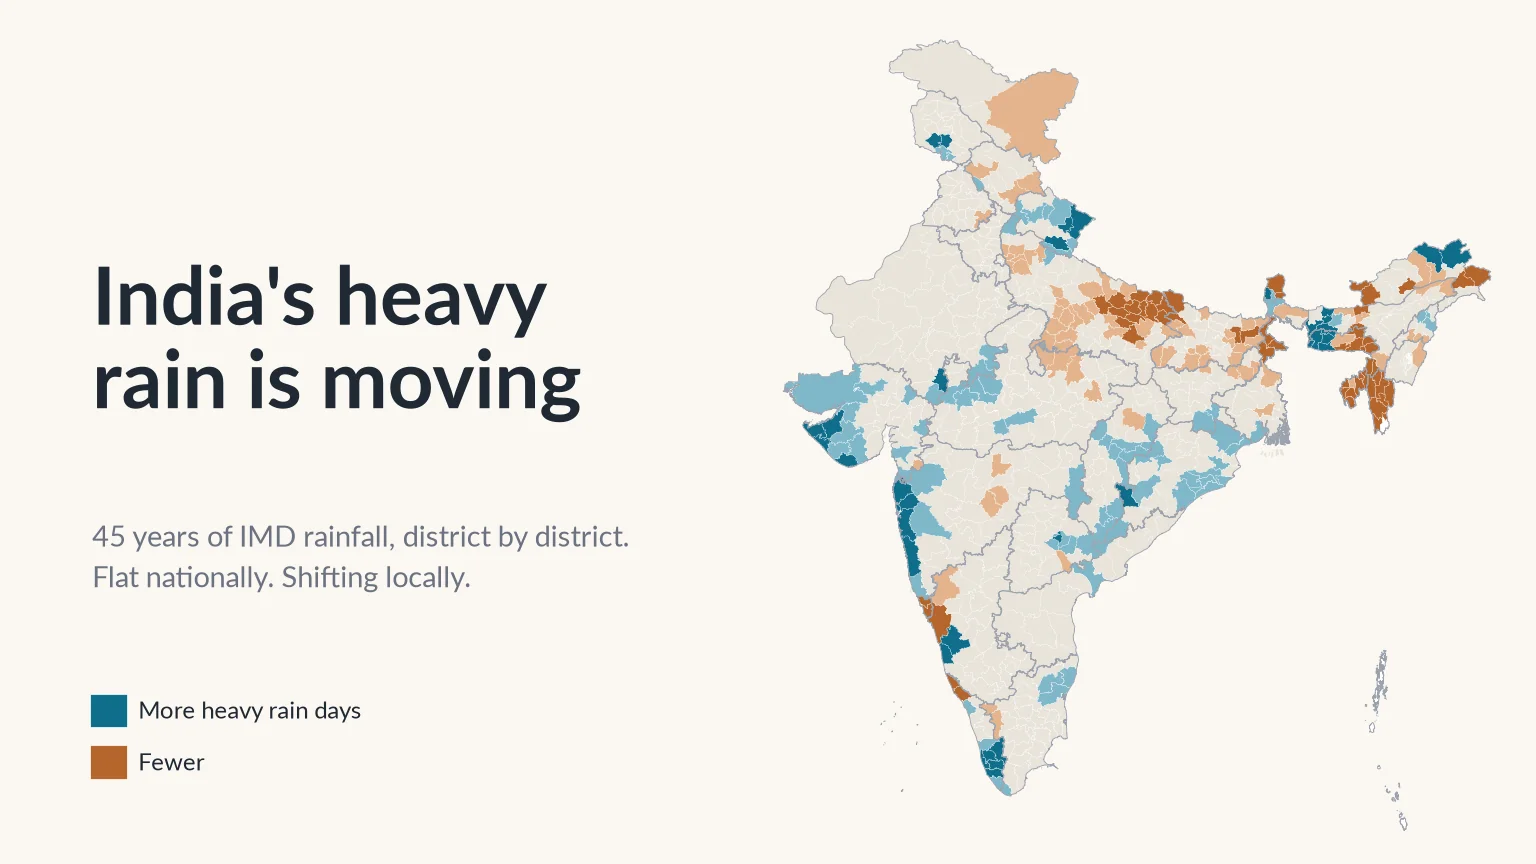
Forty-five years of IMD rainfall data show a flat national average and a very uneven map. Heavy rain days have climbed sharply across one belt of India and fallen across another, and the places gaining them are often the least ready.

Every monsoon brings the same headlines. A city goes under in an afternoon. A highway washes out. A hillside comes down on a village. Then someone on television gives what has become the standard explanation: "heavy rain is increasing across India."
It sounds right, and it is partly right. But "across India" does a lot of work in that sentence. India is a subcontinent. It has some of the wettest places on Earth and some of the driest, monsoons arriving from two directions, and mountains, plains, deserts and coastlines, each with its own rainfall. A single statement about all of it should make us suspicious.
So we went to the data and asked a simple question: is heavy rain increasing in India, and if so, where are heavy rain days actually becoming more common, and where are they not?
The answer was not what we expected, and we think it matters for anyone who builds a drain, designs a bridge, runs a district disaster cell or lives downstream of a river.
How we looked
We used the India Meteorological Department's (IMD) gridded daily rainfall dataset [1][2]. It combines readings from rain gauges across the country (6,955 stations went into the original version) into a regular grid of cells, each 0.25° (about 25 km) on a side, with one rainfall value per cell per day. Our record runs from 1 January 1979 to 31 December 2023: 45 years and 16,436 days. In our own earlier work comparing satellite rainfall products against this dataset, we used it as the reference for rainfall extremes over India [3]; it is the standard long record for this kind of question.
IMD sorts a day's rain into categories [4]. We followed three steps up that ladder:
- Heavy rain: 64.5 mm or more in 24 hours. Enough to flood low-lying streets, fill underpasses, overflow small streams and loosen slopes. This is our main measure.
- Very heavy rain: 115.6 mm or more. Enough to overwhelm most city drains and set off landslides on steep ground.
- Extremely heavy rain: 204.5 mm or more. The days that make national news.
For every grid cell and every year we counted the days in each category. We also recorded the year's wettest single day and the year's total rainfall.
To see change rather than year-to-year noise, we compared two 15-year blocks a generation apart:
- Early period: 1979–1993
- Recent period: 2009–2023
Then we overlaid the 2011 Census district boundaries [5] and averaged every grid cell touching each district. That gave us 688 districts with a complete record.
We called a district's change in heavy rain clear only if it rose or fell by at least half a day a year, roughly one extra (or one fewer) heavy rain day every two years. That is about a quarter of the national average of about two heavy rain days a year. For very heavy rain, which is about five times rarer, we used a threshold of 0.25 days a year.
The full method is at the end of this piece.
Is heavy rain increasing across India as a whole?
Hardly at all. Start with the national picture, the number that "heavy rain is increasing across India" is implicitly about.
Averaged over the whole country, a typical spot in India got 2.15 heavy rain days a year in 1979–93. In 2009–23 it got 2.18. That is an increase of about 1.6% over a generation, well inside the normal swing between one year and the next.
These are averages over every 25 km grid cell in India, which is why they can be fractions. The Konkan coast gets a dozen or more heavy rain days a year, while parts of Rajasthan get almost none. The average sits in between.
The other measures tell the same story (use the buttons above the chart to see each one):
- Very heavy rain days stayed at 0.45 a year in both periods. A typical place gets one very heavy rain day about every two years, and that has not changed.
- Extremely heavy days fell slightly, from 0.063 to 0.057 a year: roughly one every 16 years at a typical place, now one every 17 or 18.
- The wettest day of the year, averaged across the country, slipped from 91.6 mm to 90.1 mm.
- Total annual rainfall was roughly steady at about 1,150 mm.
The year-to-year swings are large. 2019 had the most heavy rain days in the record, about 2.7 per location, and 2005, 2006 and 2007 were close behind. 2002, a drought year, had the fewest, at 1.7. But these are peaks and troughs around a flat line, not steps up a staircase.
If you stopped here, you might conclude that the whole "heavy rain" story is overblown. That would be a mistake. A flat national average does not mean nothing is happening. It can also mean that big changes in opposite directions are cancelling each other out.
The map tells a different story
When we break the country into districts, the flat line comes apart.
- 120 districts, home to about 19 crore (190 million) people, now get clearly more heavy rain days than they did a generation ago.
- 140 districts, home to about 25 crore (250 million) people, get clearly fewer.
- The remaining 428 districts show no clear change either way.
So heavy rain is not rising everywhere. It is moving. And the gains are not scattered at random. They form a clear pattern: a broad belt down the west coast, through Gujarat, central India and Odisha, and up into the Uttarakhand Himalaya is gaining heavy rain, while the Gangetic plain and much of the Northeast are losing it. Search the map for your own district to see its numbers.
Heavy rain spreads further than the extremes
This is where looking at heavy rain, not just the extreme tail, changes the picture.
If we count only very heavy days (115.6 mm or more), 55 districts show a clear increase. If we count heavy days (64.5 mm or more), the number more than doubles to 120. Switch the map between the first two measures to see the difference.
Of those 120 districts, only 48 also show a clear rise in very heavy days. The other 72 are getting noticeably more heavy rain days but have not yet seen the same jump at the very top end. They include almost all of the gains in Uttarakhand, southern Kerala, coastal Odisha, Telangana and the Maharashtra interior.
That matters because heavy rain is the kind of rain that most infrastructure in India actually meets. A town's storm drains, a rural road's culverts, a hill road's retaining walls and a farmer's field bunds are rarely tested by the once-a-decade deluge. They are tested, again and again, by the 70 mm or 90 mm day. When those days become twice as common, failures that used to happen once every few years start happening every season.
It may also be an early signal. Where heavy days are climbing but very heavy days have not yet followed, the distribution of daily rain is shifting upwards. Those districts are worth watching closely.
Where in India is heavy rain increasing?
The short answer: the Konkan coast, Saurashtra and Kutch, the Uttarakhand hills, southern and central Kerala, the Garo Hills of Meghalaya, and a quieter belt across central and eastern India.
The Konkan coast and the Mumbai belt
The west coast from Ratnagiri to Daman is the most densely populated region of rising heavy rain in the country.
That is two to three more heavy rain days every year than a generation ago: Palghar went from about 7.9 to 11.4, Mumbai Suburban from 9.8 to 12.9 and Thane from 7.5 to 10.4. Here the extreme end has risen too. Mumbai Suburban's very heavy days went from 3.0 to 4.5 a year and Palghar's nearly doubled, from 2.0 to 3.7.
This is the region that came to a standstill on 26 July 2005. On our grid, which records each day's rain for the 24 hours ending at 8:30 am and so lists that deluge under 27 July, it put about 730 mm on the cells over Thane, Palghar and Mumbai Suburban, and it remains their wettest day on record. The 2005 flood is often remembered as a freak event. The data suggest it was an early, extreme example of a pattern that has since become more common.
Inland, Pune (2.8 to 3.4 heavy days a year) and Nashik (2.1 to 2.8) are also rising.
Saurashtra and Kutch
This is the finding we least expected. Saurashtra and Kutch have long been thought of as dry country, and in absolute terms they still are. Kutch received about 380 mm of rain a year in our early period. But the change is large relative to that baseline.
- Devbhumi Dwarka: heavy rain days doubled, from 1.7 to 3.5 a year.
- Morbi: from 1.0 to 1.9 (+87%).
- Jamnagar: from 1.6 to 2.8 (+77%).
- Porbandar: from 2.3 to 3.7 (+64%).
- Kutch: from 1.1 to 1.7 (+55%).
- Rajkot: from 1.6 to 2.5 (+53%).
Very heavy days rose by between about 60% and 110% in these districts, and roughly doubled in Devbhumi Dwarka and Morbi. Total rainfall in Jamnagar rose from about 550 mm to 810 mm a year, and in Kutch from about 380 mm to 560 mm.
Gujarat as a whole has 14 districts with clearly more heavy rain and only 1 with fewer. A region with sandy soils, flat terrain and little history of flash floods is now getting the kind of rain that once belonged to the Konkan.
The Uttarakhand Himalaya
On the very heavy measure, Uttarakhand barely registers. On the heavy measure it is one of the strongest signals in India: 9 of its 13 districts show clear gains, and none show losses.
- Chamoli: from 0.7 to 1.7 heavy rain days a year (+139%).
- Rudraprayag: from 0.7 to 1.4 (+115%).
- Bageshwar: from 1.3 to 2.7 (+107%).
- Pithoragarh: from 1.7 to 2.8 (+66%).
- Tehri Garhwal: from 0.9 to 1.5 (+62%).
- Dehradun: from 1.9 to 2.6 (+41%).
In mountain valleys, 70 mm of rain in a day on already saturated slopes is enough to bring down roads and hillsides. Rudraprayag is the district of the June 2013 Kedarnath disaster, in which heavy, continuous rain combined with snowmelt and the overflow or collapse of Chorabari Lake above the town [6]. More heavy days means more days with that kind of risk.
Southern and central Kerala
On the very heavy measure, Kerala's clearest gains are in the north, in Kozhikode and Malappuram. On the heavy measure the strongest gains are in the south and centre.
- Pathanamthitta: from 2.3 to 4.2 heavy rain days a year (+82%).
- Kottayam: from 4.0 to 7.1 (+75%).
- Thiruvananthapuram: from 1.4 to 2.4 (+68%).
- Kollam: from 2.1 to 3.5 (+67%).
- Alappuzha: from 4.2 to 6.0 (+43%).
Kerala has the largest average gain of any state: 8 of its 14 districts show clearly more heavy rain days. They include the low-lying backwater district of Alappuzha and Pathanamthitta in the Pamba basin, one of four sub-basins that the Central Water Commission found heavily flooded in August 2018 [7]. Next door in Tamil Nadu, Kanniyakumari rose by 63%.
The Garo Hills of Meghalaya
The largest absolute gains anywhere in India are in western Meghalaya. In South Garo Hills heavy rain days rose from about 16 to 25 a year. In East Garo Hills they doubled, from 8 to 17, and in West Garo Hills from 5.5 to 11. Very heavy days more than doubled in most of these districts. The neighbouring districts of lower Assam (Bongaigaon, Goalpara, Dhubri) show the same pattern on a smaller scale.
Central and eastern India
A quieter but widespread signal runs across the Deccan and towards the Bay of Bengal:
- Odisha: 14 of 30 districts show clearly more heavy rain days and none show fewer. Khordha, home to Bhubaneswar, rose from 2.5 to 3.4, and Cuttack from 2.7 to 3.4.
- Chhattisgarh: 10 of 27 districts are up. Raipur rose from 1.7 to 2.3 and Bastar from 2.0 to 2.9. Very heavy days roughly doubled in both.
- Telangana: Warangal Urban rose from 1.4 to 2.6 heavy days a year (+78%).
- Bengaluru: still low in absolute terms, Bengaluru district rose from 0.7 to 1.05 heavy days a year (+54%).
Where heavy rain is declining
The other half of the story gets less attention, because nobody writes headlines about floods that didn't happen. It is just as important for understanding the map.
The Gangetic plain
This is the largest region of decline in the country, and the most populous.
- Uttar Pradesh: 40 of 75 districts show clearly fewer heavy rain days, and only 2 show more. The average across the state's districts fell from 2.0 to 1.5 heavy days a year. Gorakhpur halved, from 3.4 to 1.8, and Lucknow fell from 2.0 to 1.5.
- Bihar: 20 of 38 districts show clear declines and none show gains. Patna fell from 1.9 to 1.5.
- Delhi: 5 of its 9 districts are clearly down. New Delhi went from about 0.9 heavy days a year to 0.3.
- West Bengal: 6 districts down, 2 up.
The plains still flood, of course. Much of Bihar's and eastern Uttar Pradesh's flooding comes from rivers carrying rain that fell in Nepal and the Himalaya, not from rain on the plain itself. Urban flooding in Delhi or Lucknow is driven as much by blocked drains and paved-over floodplains as by the rain. But locally generated heavy rain is becoming less common across the plain, not more.
Tripura, Mizoram and eastern Meghalaya
All 8 of Tripura's districts show clear declines, and so do all 7 Mizoram districts with a complete record. Tripura's average fell from 5.4 to 3.6 heavy days a year.
The most striking contrast is inside Meghalaya itself. While the Garo Hills in the west gained enormously, the Khasi and Jaintia Hills in the east lost:
- East Khasi Hills (which includes Shillong and Sohra, or Cherrapunji): from about 18 to 8 heavy rain days a year.
- West Jaintia Hills: from 8.1 to 2.3.
- Ribhoi: from 6.6 to 2.2.
Within a single small state, heavy rain appears to have shifted westward by roughly 100–200 km. We are cautious about the Northeast, because rain-gauge coverage in its hills is thin and gridded data there leans heavily on interpolation. But the east–west split is consistent across many neighbouring districts and on every measure we looked at, which makes it unlikely to be a quirk of one gauge.
Goa and Himachal Pradesh
North and South Goa both lost about two heavy days a year. They are still among the wettest districts in the country, but they are a reminder that "the west coast" is not one story: Mumbai, about 400 km to the north, went the other way.
In Himachal Pradesh, heavy rain days are flat or falling across most of the state on our grid. Shimla and Kullu roughly halved, Kangra fell by about a fifth, and Mandi changed little. Only Una, on the Punjab border, shows a clear rise. We come back to this below, because it is not what people in Himachal have lived through.
A tale of two Indias
When we roll the districts up to states, a clear divide appears.
The western coastal Union Territories, Dadra and Nagar Haveli and Daman and Diu, also lean towards more heavy rain. Two states are split down the middle: Meghalaya, with 5 districts showing more and 6 fewer, and Assam, with 5 more and 9 fewer.
Put simply, the peninsula and the Uttarakhand Himalaya are getting more heavy rain days, and the Gangetic plain and the far Northeast are getting fewer. Roughly 19 crore people live in districts where heavy rain has clearly increased, and 25 crore in districts where it has clearly fallen. Averaged together, they produce the flat national line.
The split states are the ones to watch. In Meghalaya and Assam, a state-level average would suggest little has changed. In fact some districts are seeing far more heavy rain and others far less. A state disaster plan built on the state average would be wrong for both.
This is the core point of the analysis. A national average hides regional change, and a state average often hides district change. The scale at which you measure decides what you are able to see.
The record days are recent
Counting heavy days tells you how often rain crosses a line. The other question is how far past the line the worst day goes.
The five districts with the highest one-day totals on India's rainfall grid since 1979 are all in Meghalaya, and all set their records on the same day in mid-June 2022:
- West Khasi Hills and South West Khasi Hills: about 980 mm
- South Garo Hills: about 920 mm
- East Garo Hills: about 900 mm
- East Khasi Hills: about 890 mm
Close to 1,000 mm in 24 hours is most of a year of India's average rainfall falling in a single day. Remember that these are averages over cells about 25 km wide. A single gauge can record more than its cell: the IMD gauge at Sohra (Cherrapunji), in East Khasi Hills, measured 972 mm in the 24 hours to 8:30 am on 17 June 2022 [8], against about 890 mm for the wettest grid cell in that district.
Not every record is recent. Purba Medinipur on the Bengal coast holds about 750 mm from 1991, the Mumbai belt about 730 mm from 2005 and Saurashtra about 720 mm from 1983. We have left out two higher values that sit in a single grid cell with no support from the cells around it, about 820 mm in Chhindwara in 2001 and about 800 mm in lower Assam in 1984; a lone value like that is more likely to come from one faulty gauge record than from a real storm. But the very top of the list belongs to the last few years, in exactly the region where heavy rain days are rising fastest.
What does this mean for planning?
1. Planning from averages is planning for the wrong place
Almost every piece of water infrastructure in India is designed from historical rainfall: storm drains, culverts, road embankments, bridge openings, urban flood channels and dam spillways. Engineers use intensity–duration–frequency curves and design storms built from past records, often decades-old ones.
Where heavy rain has moved, those designs are now out of date in both directions. In Saurashtra, Uttarakhand or southern Kerala, the rainfall a structure was sized for in the 1980s is now exceeded more often, so it will be overtopped more often than its designers intended. In eastern Uttar Pradesh or Tripura the opposite may be true. That is not a reason to relax, because the river floods that hit those regions are driven by rain elsewhere. But it does mean that a single, uniform rule, such as adding the same percentage to design rainfall everywhere, would over-build in some places and badly under-build in others.
2. The everyday heavy day is the one that wears infrastructure down
Public attention goes to record-breaking deluges. Maintenance budgets and failures are driven by the ordinary heavy day: the 70 mm afternoon that floods an underpass, blocks a hill road with a small slip, or overtops a village culvert. In 120 districts those days are now clearly more frequent. That shows up as more potholes, more road closures, more crop damage and more small landslides long before it shows up as a headline disaster.
3. A 25 km grid can't see a cloudburst
The dataset we used is one of the best long-term rainfall records available for India. It still has a basic limitation: it smooths rain over cells about 25 km wide.
Himachal Pradesh, where we are based, shows this clearly. Our analysis finds no clear rise in heavy rain days in Mandi, Kullu, Shimla or Kangra, and no clear rise in very heavy rain days anywhere in the state. Yet Himachal has suffered repeated disasters in recent monsoons: the floods of July 2023, which we analysed in detail [9], and the cloudbursts of July 2025 in Mandi district, which killed more than a dozen people and damaged more than 150 homes and 14 bridges [10].
There is no contradiction here. A cloudburst drops a burst of very intense rain on a few square kilometres of hillside while the valley next door stays dry. A grid cell at Himachal's latitude covers about 650 sq km. As an illustrative example, 100 mm falling on 10 sq km, spread over a 650 sq km cell, becomes 100 × 10 ÷ 650 ≈ 1.5 mm: an ordinary wet day on the grid. The grid is not wrong. It simply cannot see storms smaller than itself, and in the mountains those are the ones that kill. Next door in Uttarakhand, where the grid does pick up a sharp rise in heavy days, the true local picture is likely to be more severe still. We explain why these storms leave so little warning time in flash floods vs river floods.
The same applies to cities. A 25 km cell over Mumbai covers most of the city. It cannot tell you which ward flooded, which underpass filled or which drain backed up.
4. Districts new to heavy rain are the least prepared
Mumbai has decades of hard-won flood experience. It has a dense network of automatic weather stations, a municipal disaster cell and a population that knows what a red alert means.
Jamnagar, Morbi, Devbhumi Dwarka and Kutch have little of that. Nor do Raipur, Warangal or the hill towns of Chamoli and Bageshwar. Their drainage, building practice and emergency planning grew up around far fewer heavy rain days. When heavy rain moves into places like these, the damage from each event is likely to be larger than the rain alone would suggest, because nothing local is built for it.
5. Declines are not the all-clear
Fewer heavy rain days on the Gangetic plain or in Tripura does not mean less flood risk. Rivers carry rain from far upstream, and a drying trend brings its own problems for agriculture and groundwater. The lesson is not that some places are safe. It is that each place's risk has to be measured where it is.
What would help
The answer to a moving target is not a better national average. It is denser local measurement:
- Rain gauges where people live, at village and ward scale, reporting in real time rather than at the end of the day. How many a district needs is a question we look at in how many rain gauges does a district need.
- River-level sensors on the small streams and nallahs that rise first, not just the large rivers with central gauging stations.
- Warnings that reach people in time: on their phones, in their language, and through sirens and community networks where phones are not enough.
- Design standards that are regularly updated from local data, so a culvert built in Jamnagar or Chamoli today is designed for that district's rain today, not its state's rain in 1985.
None of this needs a breakthrough. It needs instruments in the ground, data that flows, and a system that turns a reading into an alert before the water arrives.
Key points
- Averaged over India, heavy rain days (64.5 mm or more) barely changed between 1979–93 and 2009–23: 2.15 and 2.18 a year.
- District by district, 120 districts (about 19 crore people) got clearly more heavy rain days, 140 (about 25 crore) clearly fewer, and 428 show no clear change.
- Gains run down the Konkan coast, across Saurashtra and Kutch, through central India and Odisha, into the Uttarakhand hills, southern Kerala and the Garo Hills; losses span the Gangetic plain, Tripura, Mizoram and eastern Meghalaya.
- Heavy rain has spread further than the extremes: 120 districts gained heavy days but only 55 gained very heavy days.
- The five districts with the highest one-day totals on the grid since 1979 are all in Meghalaya, and all set their records in June 2022.
- A 25 km grid cannot see cloudbursts; local risk needs local measurement.
That is what we build at ClimMaTech. VARSHAQ, our weather station in development, will measure rainfall where it falls. TARANG, a radar automatic water level recorder (AWLR), tracks water levels on rivers and streams without touching the water, and PRAVAAH, an AWLR and surface velocity radar (SVR), also gives non-contact discharge with a surveyed cross-section and a site-calibrated coefficient. RAKSHAK, a multi-hazard warning siren with 15–20 user-selectable siren tones and voice messages, carries the alert to the people who need it. All are designed and made in Mandi, Himachal Pradesh, in a district that has learned first-hand what a 25 km grid cannot see.
Method
Data: IMD 0.25° × 0.25° gridded daily rainfall [1][2], 1 January 1979 to 31 December 2023.
Indicators, computed per grid cell per year: number of days with 64.5 mm or more (heavy), 115.6 mm or more (very heavy) and 204.5 mm or more (extremely heavy), following IMD categories [4]; maximum one-day rainfall; and annual total.
National series: area-weighted average over all valid land cells (weighted by the cosine of latitude).
Periods: 1979–1993 (early) and 2009–2023 (recent), 15 years each. Change is the difference between the two period means; we did not fit a trend line.
Districts: 2011 Census boundaries [5]. Each district's value is the mean over all grid cells touching the district, and its wettest day is the highest one-day value in any of those cells, leaving out values that no neighbouring cell supports with at least half as much rain on the same day. A "clear" change means at least 0.5 heavy rain days a year, or at least 0.25 very heavy rain days a year, between the two periods. Districts with incomplete early records were excluded, leaving 688. Population figures are from the 2011 Census; districts formed after 2011 have no Census figure of their own and are not counted in the population totals.
Caveats: rain-gauge coverage is sparse in the hilly Northeast and in parts of the Himalaya, so gridded values there depend more on interpolation and are less certain. A 25 km grid smooths out short, localised storms such as cloudbursts. Comparing two 15-year periods shows change, but it does not on its own separate long-term climate trends from decadal variability. Maps are approximate and not to scale.
References
- Pai, D.S., Sridhar, L., Rajeevan, M., Sreejith, O.P., Satbhai, N.S. and Mukhopadhyay, B., Development of a new high spatial resolution (0.25° × 0.25°) long period (1901–2010) daily gridded rainfall data set over India and its comparison with existing data sets over the region, Mausam 65(1), 1–18, 2014. https://doi.org/10.54302/mausam.v65i1.851
- India Meteorological Department, Pune, High resolution (0.25 × 0.25 degree) gridded daily rainfall data (NetCDF), IMD. https://www.imdpune.gov.in/cmpg/Griddata/Rainfall_25_NetCDF.html
- Gupta, V., Jain, M.K., Singh, P.K. and Singh, V., An assessment of global satellite-based precipitation datasets in capturing precipitation extremes: a comparison with observed precipitation dataset in India, International Journal of Climatology 40(8), 3667–3688, 2020. https://doi.org/10.1002/joc.6419
- India Meteorological Department, RSMC New Delhi, Press release, 2 March 2022 (legend of rainfall intensity terms: heavy 64.5–115.5 mm, very heavy 115.6–204.4 mm, extremely heavy above 204.4 mm), IMD, 2022. https://rsmcnewdelhi.imd.gov.in/uploads/archive/8/8_605370_Press%20Release%2002.03.2022_1.pdf
- Office of the Registrar General and Census Commissioner, India, Census of India 2011: census tables (Primary Census Abstract), Ministry of Home Affairs, 2011. https://censusindia.gov.in/census.website/data/census-tables
- Singh, R., Siingh, D., Gokani, S.A., Sreeush, M.G., Buchunde, P.S., Maurya, A.K., Singh, R.P. and Singh, A.K., Brief Communication: Climatic, meteorological and topographical causes of the 16–17 June 2013 Kedarnath (India) natural disaster event, Natural Hazards and Earth System Sciences 15, 1597–1601, 2015. https://doi.org/10.5194/nhess-15-1597-2015
- Aggarwal, M., CWC report on Kerala floods: dams not to be blamed, Mongabay India, 18 September 2018. https://india.mongabay.com/2018/09/cwc-report-on-kerala-floods-dams-not-to-be-blamed/
- Press Trust of India, Another record for Cherrapunji, receives 972 mm rainfall in a day, The Tribune, 17 June 2022. https://www.tribuneindia.com/news/nation/another-record-for-cherrapunji-receives-972-mm-rainfall-in-a-day-404694
- Gupta, V., Syed, B., Pathania, A., Raaj, S., Nanda, A., Awasthi, S. and Shukla, D.P., Hydrometeorological analysis of July-2023 floods in Himachal Pradesh, India, Natural Hazards 120(8), 7549–7574, 2024. https://doi.org/10.1007/s11069-024-06520-5
- Press Trust of India, Mandi cloudburst death toll mounts to 13, search underway for 29 missing, The Tribune, 3 July 2025. https://www.tribuneindia.com/news/himachal/mandi-cloudburst-death-toll-mounts-to-13-search-underway-for-29-missing/amp
Data credits: rainfall data from the India Meteorological Department; district boundaries and population from the Census of India 2011. Analysis, maps and charts: ClimMaTech.