
Gauge zero, datum and benchmarks: why two water-level records disagree
What a river level is measured from, how staff gauges and automatic sensors are tied to benchmarks, and how to reconcile records that read differently for the same water.

Imagine a district control room that receives three numbers for the same river on the same morning. The staff gauge reads 2.35 m. A new automatic sensor at the bridge reports 809.34 m. Another office says the river is 0.85 m below danger level. Are these consistent? Is the river closer to danger than last year? Nobody can say, because none of the numbers means anything until you know what it is measured from.
Every water level is a height above some reference surface. Most disagreements between water-level records are not measurement errors in the usual sense. They are differences in that reference, or undocumented changes to it. This article explains the vocabulary, how a station is tied to India's national height system, why records disagree, and how to reconcile them.
Stage, gauge height and elevation
The WMO Manual on Stream Gauging defines the stage of a river as the height of the water surface above an established datum plane [1]. Two kinds of number follow:
- Gauge height: the water level above the station's own gauge datum, usually an arbitrary level chosen for convenience. This is the normal way river stage is recorded [1].
- Elevation: the water level above an established vertical datum such as mean sea level, the usual way for lakes, reservoirs and estuaries [1].
The gauge datum is the reference surface to which all gauges at a station are set. It is the zero mark on the gauges [2], which Indian field practice calls the gauge zero [7]. A datum, in general, is any agreed reference surface from which heights are measured. The two kinds of number are related by:
Water-surface elevation = Elevation of gauge zero + Gauge heightEverything that follows is about knowing the first term on the right, keeping it constant, and recording it whenever it changes.
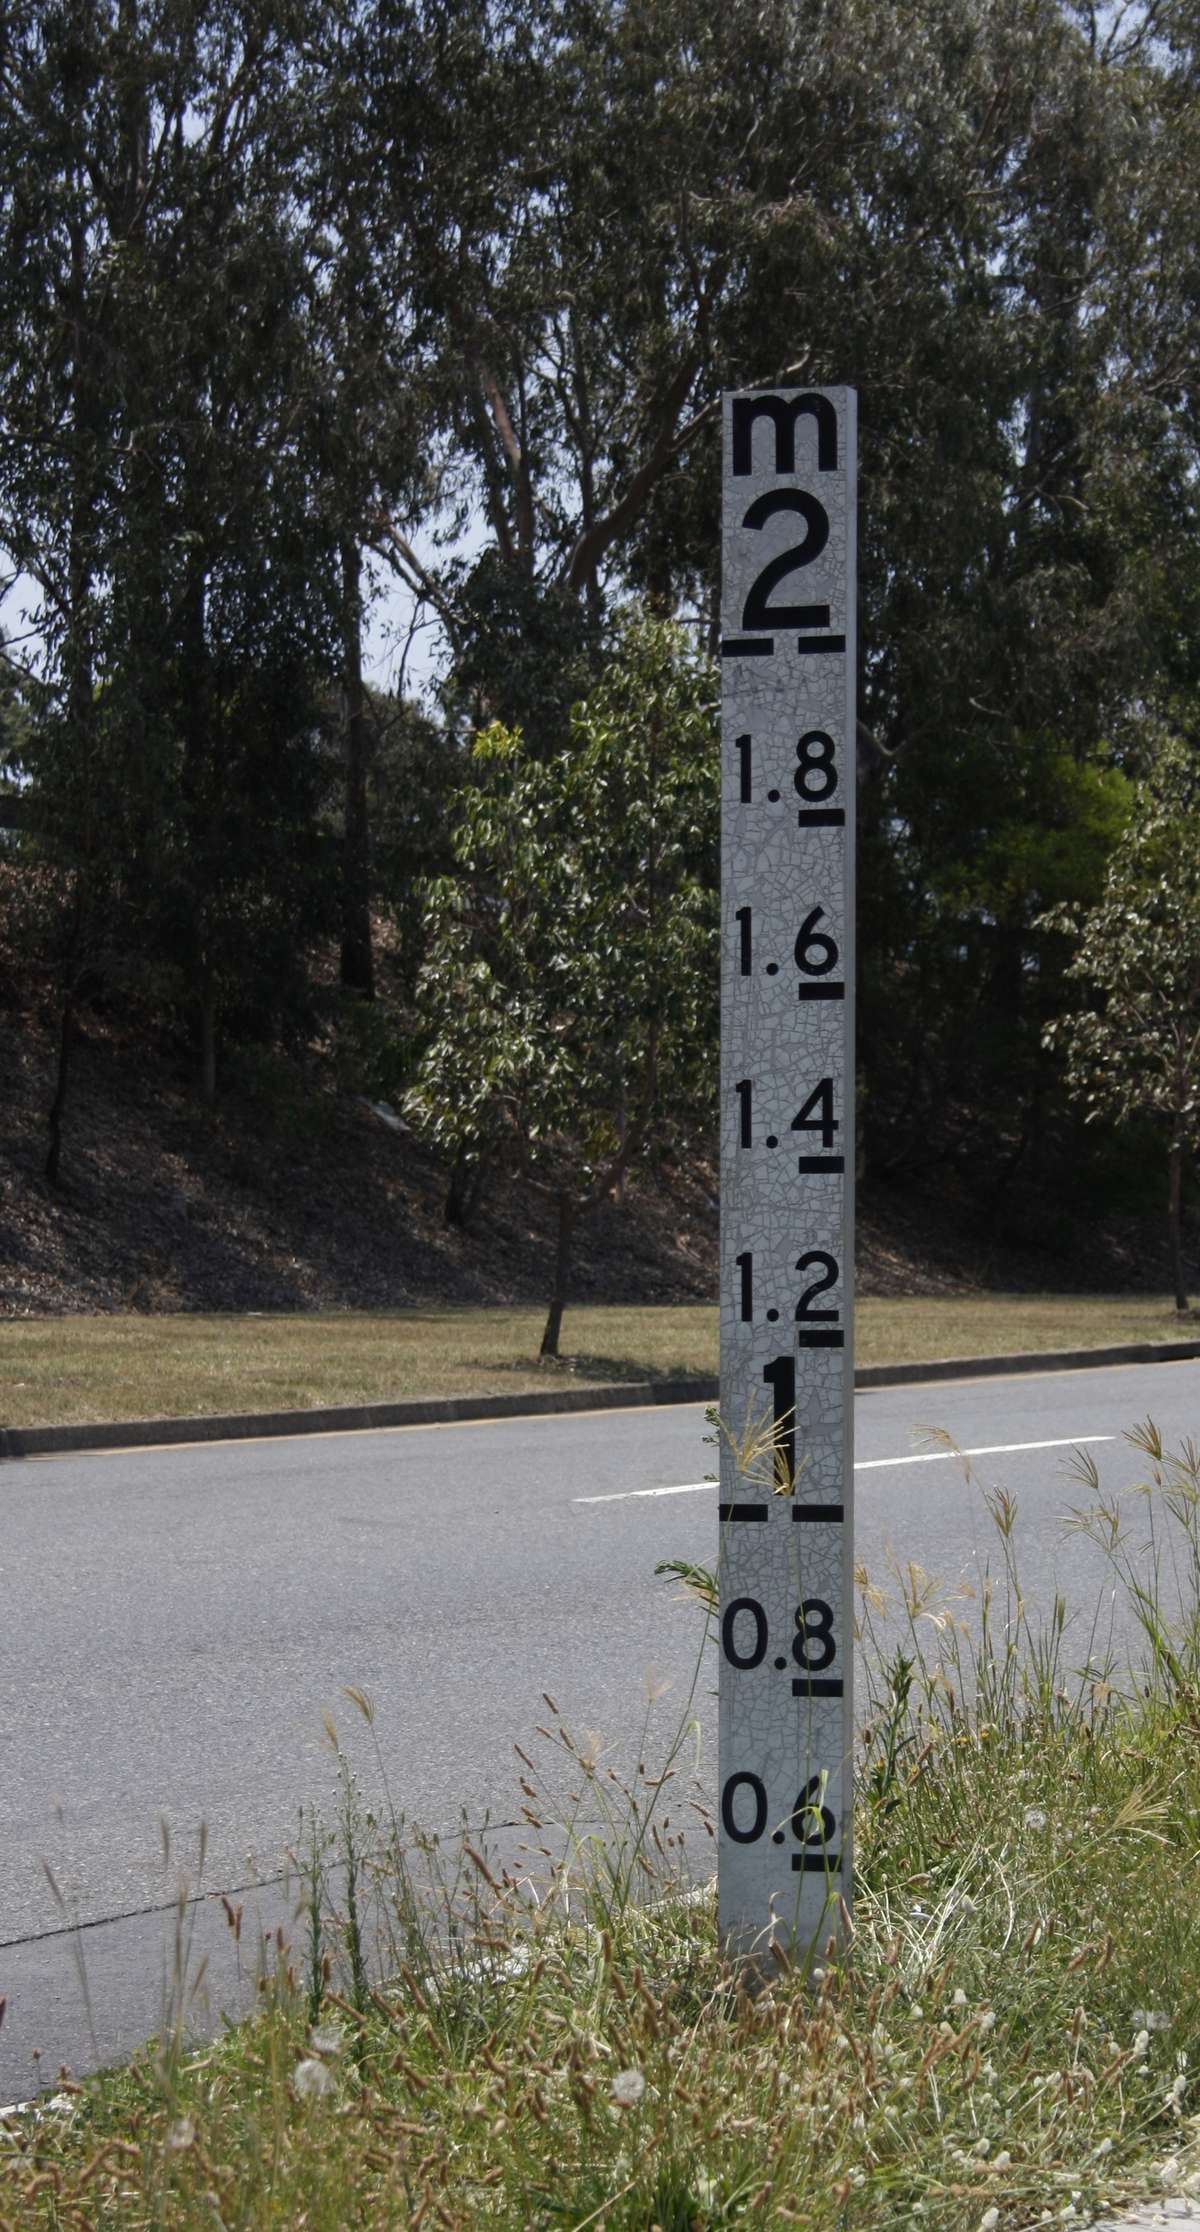
Why stations use a local gauge zero
Gauge heights are easier to read, record and use when they are small positive numbers. WMO recommends choosing an arbitrary gauge datum so that negative gauge heights never occur, which means setting it below the lowest expected level, at or below the level of zero flow on the control [1]. The USGS adds that it should sit well below the likely maximum scour depth, so that negative gauge heights do not appear over the life of the station [2].
Both documents ask for the local zero to be permanent, so that one datum serves the whole record, and to be tied by levelling to the national datum [1][2]. A local zero with a known elevation gives small, convenient numbers without losing the ability to compare with other stations.
The national vertical datum in India
Heights in India are referred to a mean-sea-level datum maintained by the Survey of India (SoI). A paper by the Director of SoI's Geodetic and Research Branch states that the Indian vertical datum was realised in 1909 from the average mean sea level at nine tide gauges, from Karachi and Bombay on the west coast to Madras and Vishakhapatnam on the east, assuming that mean sea level at all of them was the same level surface [5]. An SoI note dates the definition to 1905 and adds that it was made without gravity observations [4]. Two facts from these sources matter for river work:
- Mean sea level is not one level surface. A readjustment of the levelling network in 1977-1983 found a difference of about 35 cm between the Mumbai and Chennai tide gauges, the west coast being lower [5].
- Many old benchmarks are unreliable. SoI reports that about 70 % of old benchmarks no longer exist or are disturbed. Its programme "Redefinition of Indian Vertical Datum", started in 2006, had completed about 46,000 km of high-precision levelling in its first phase by 2014 [4].
A benchmark is a permanent mark whose elevation on the national datum has been fixed by precise levelling. It is only as good as its network and the ground it sits on, so before using one near a station, confirm that it is intact and find out which levelling its value comes from.
The Central Water Commission (CWC) states that river stage at its observation sites is measured as elevation above the "GTS datum", with staff gauges built to IS 4080 and read to 0.005 m [6]. Its field forms record "Zero R L (GTS)", the reduced level of the gauge zero [7]. This is why CWC bulletin levels look nothing like staff readings: on 2 June 2021, the Kamla at Jainagar (Madhubani, Bihar) was listed with a warning level of 67.25 m, a danger level of 67.75 m, a highest flood level of 71.35 m and an observed level of 67.78 m [8].
GNSS heights are a different kind of height
Survey-grade GNSS is now a common way to tie a station to an established datum [2]. But a GNSS receiver gives an ellipsoidal height (h) above a mathematical ellipsoid, while mean-sea-level heights are orthometric heights (H) above the geoid, the gravity-defined surface that mean sea level approximates. They are related through the geoid separation (N) [5]:
H ≈ h − NUsing an ellipsoidal height as if it were a mean-sea-level elevation is an easy way to get a gauge zero badly wrong. The conversion needs a geoid model, and the result should be checked against a benchmark.
Reference marks, levelling and how often to check
A station keeps its datum through reference marks: permanent marks nearby whose elevations above gauge zero are known. WMO and USGS both call for at least three, independent of the gauge structure [1][2]. The USGS adds that they should not all be on one bridge, that at least one should ideally be outside the floodplain, and that typical marks are tablets in rock, bolts in masonry or rods concreted into stable ground [2].
Differential levelling carries elevations from point to point. A staff reading on a point of known elevation (the backsight) gives the height of the instrument's line of sight. A reading on the next point (the foresight) gives that point's elevation. Once one reference mark has a national-datum elevation, the elevation of gauge zero is that value minus the mark's height above gauge zero [2].
Gauges and marks move: structures settle or heave, floods damage posts, construction disturbs marks. WMO recommends levels at least yearly at new or unstable sites and every 2 or 3 years once the datum is shown to be stable. It asks that reference-gauge datum be kept to 0.003 m, and says gauges generally need not be reset unless the discrepancy exceeds 0.006 m [1]. The USGS resets a reference gauge found 0.015 ft (about 4.6 mm) or more from datum, corrects the recorded stage, and runs levels whenever gauge readings disagree without explanation or a flood or construction may have disturbed the station [2].
Worked example: from stage to elevation, and back
The numbers are illustrative, chosen to show the arithmetic, not taken from a real station.
A hill-river station has a staff gauge, three reference marks and a radar water-level sensor on a bridge. An SoI benchmark (BM) nearby has a published elevation of 812.340 m. The figure shows the whole chain; the steps below work through it.
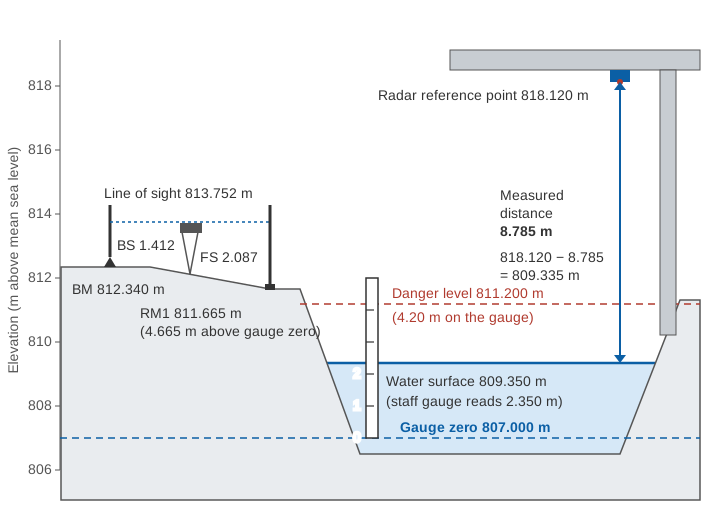
Step 1: carry the benchmark elevation to reference mark RM1.
Backsight on BM        = 1.412 m
Height of instrument   = 812.340 + 1.412 = 813.752 m
Foresight on RM1       = 2.087 m
Elevation of RM1       = 813.752 − 2.087 = 811.665 m
In practice the run is closed back to the BM and the misclosure checked against tolerance [2].
Step 2: elevation of gauge zero. The station record gives RM1 as 4.665 m above gauge zero.
Elevation of gauge zero = 811.665 − 4.665 = 807.000 mStep 3: stage to elevation.
Staff reading 2.350 m  → 807.000 + 2.350 = 809.350 m
Danger level 4.200 m   → 807.000 + 4.200 = 811.200 m
Step 4: a record on an older zero. Suppose that before scour forced a reset, the zero was 1.000 m lower, at 806.000 m, and another office still uses it:
Same water on old zero = 809.350 − 806.000 = 3.350 mThe two records now differ by exactly 1 m every day, and both are "correct". If the danger level of 4.20 m was set on the old zero, it sits at 806.000 + 4.200 = 810.200 m, a metre lower than 4.20 m on the new zero. On the old scale the river is 4.20 − 3.35 = 0.85 m below danger; on the new scale it is 1.85 m below. That is the third number in the control room.
Step 5: check the automatic sensor. The radar measures distance down to the water from a reference point on its mounting, levelled at 818.120 m. At the time of the staff reading it measured 8.785 m.
Radar water elevation  = 818.120 − 8.785 = 809.335 m
Staff water elevation  = 809.350 m
Difference             = −0.015 m
The sensor reads 15 mm low, more than WMO's 0.006 m adjustment threshold for reference gauges [1]. Repeat the comparison on a steady level, look for a cause (a disturbed mounting, a configuration change, waves or turbulence under the sensor), then apply a correction with its date, size and reason recorded. ISO 4373, which sets functional requirements for both contact and non-contact (radar and ultrasonic) level devices [3], applies to the instrument; the tie to gauge zero is the station's job.
Try the conversion yourself. Change the sensor reading, or move gauge zero by a metre as in Step 4, and watch the stage and the margin to danger level change while the water surface stays where it is.
Why two records disagree
| Source | What happens | Typical size | Detect or fix |
|---|---|---|---|
| Different datums | Local gauge height vs elevation above mean sea level | Metres to hundreds of metres, constant | Get the elevation of each gauge zero; convert both |
| Gauge zero changed | Reset after scour, damage or relocation; WMO recommends whole-metre changes [1] | Step, often whole metres | Station history of datum changes [1] |
| Different benchmarks | Different levelling, or disturbed marks [4] | Centimetres to decimetres | Level both stations from the same benchmark |
| GNSS height taken as mean sea level | Ellipsoidal height not converted | Large, site-dependent | Convert with a geoid model; check a benchmark |
| Sensor offset or set-up | Wrong reference height, sign or units | Millimetres to metres | Routine staff-gauge comparison |
| Structure movement | Settlement or heave; a 25 m steel well warmed by 40 °C lifts its shelf 0.012 m [1] | Millimetres to centimetres | Periodic levels [1][2] |
| Float and transducer errors | Leaking float, slipped tape, calibration drift [1] | Millimetres to centimetres | Comparison with reference gauge |
| Drawdown at intakes | High velocity at a stilling-well intake or bubbler orifice, 0.15 m or more [1] | Grows at high flow | Inside and outside readings in floods [1] |
| Different locations | Water-surface slope, backwater from a confluence, tides [1] | Centimetres to metres, varies with flow | Compare at the same section |
| Timing | Instantaneous vs averaged values, or different hours | Depends on rate of rise | Store instantaneous, time-stamped values [1] |
A constant difference between two records almost always means a datum or offset problem, easy to fix once the datum facts are known. A difference that changes with flow means hydraulics: slope, backwater or drawdown. No datum correction removes it, because the two instruments see different water surfaces.
Reconciling two records
- Collect the datum facts. For each station: the elevation of gauge zero, the datum and benchmark it refers to, the date of levelling, and every change of zero. A record that cannot say what it is measured from is uncalibrated.
- Convert to elevation on one datum, using stations tied to the same levelling or to benchmarks known to agree.
- Compare the sensor with the staff gauge at every visit and plot the difference over time. CWC's field manual asks observers to compare recorders with the reference staff gauge daily [7]. A step that lines up with a flood, a repair or a datum change points to the datum; the field routine for this comparison is in our post-monsoon maintenance checklist, and how step and drift corrections are applied is covered in data quality control for hydromet time series.
- Document every change. WMO asks for a permanent record of all datum changes [1]. When the bed falls below the lowest gauge, CWC's manual has observers record negative stages until the gauges are resurveyed and reinstalled on a new datum, with the change fully documented in the station record [7]. Keep raw readings unaltered and store corrections separately.
On the sensor side, see how to choose a river water-level sensor and radar, ultrasonic, float and pressure sensors compared.
Danger levels need a datum
Warning levels, danger levels and highest flood levels are thresholds on a height scale. In CWC bulletins a site is in a "severe" flood situation when the level reaches the danger level but is below the highest flood level [8], a comparison that only works if both numbers share a datum. As the worked example shows, "4.20 m" can mean 811.20 m or 810.20 m. Good practice:
- state every threshold with its datum, for example "811.20 m above mean sea level (SoI datum)" or "4.20 m on the gauge zero set in 2024";
- re-express thresholds whenever the gauge zero changes, keeping the old values with dates;
- when an automatic sensor goes live, check that its alarms trigger at the same water surface as the staff-gauge thresholds.
Discharge depends on the datum too: a rating curve relates discharge to stage on one gauge zero, so a datum change without a matching change to the rating gives wrong discharge. See rating curves: from stage to discharge.
Key points
- A water level means nothing without its reference. Gauge height is above a local gauge zero; elevation is above a national datum.
- Gauge zero should be below the lowest expected level, permanent, tied to at least three independent reference marks and, ideally, to the national datum [1][2].
- India's vertical datum is a century-old mean-sea-level datum maintained by the Survey of India; many old benchmarks are disturbed and it is being redefined [4][5].
- CWC reports stage as elevation above the GTS datum, so its thresholds are elevations, not staff readings [6][8].
- Constant differences between records point to datums and offsets; flow-dependent differences point to hydraulics.
- Check sensors against the staff gauge, run levels regularly, and record every datum change and every threshold with its datum.
At ClimMaTech we work on river monitoring in Himalayan catchments, where floods damage gauges and scour beds, so we treat the datum record as part of the measurement. A Tarang radar water-level sensor, an automatic water level recorder (AWLR), measures the distance to the water; it becomes a trustworthy stage only when its reference is tied to the staff gauge and benchmarks as described here. Through our river monitoring work we help agencies set up those ties, keep offsets and datum changes with the data, and state thresholds on a known datum.
References
- World Meteorological Organization, Manual on Stream Gauging, Volume I: Fieldwork, WMO-No. 1044, Chapter 4 (Measurement of stage), WMO, 2010. old.wmo.int
- T. A. Kenney, Levels at Gaging Stations, U.S. Geological Survey Techniques and Methods 3-A19, USGS, 2010. doi.org/10.3133/tm3A19
- International Organization for Standardization, ISO 4373:2022 Hydrometry: Water level measuring devices, ISO, 2022. iso.org
- Survey of India, Redefinition of Indian Vertical Datum (compiled from the Additional Surveyor General's conference, August 2014), Survey of India. surveyofindia.gov.in
- S. K. Singh, Towards a New Vertical Datum for India, FIG Congress 2018, Istanbul, International Federation of Surveyors, 2018. fig.net
- Central Water Commission, Gauge Observations (HO/FF network), Ministry of Jal Shakti. cwc.gov.in
- Central Water Commission, National Surface Water Data Center, Gauge & Discharge Measurement Field Manual (prepared under the Hydrology Project), CWC, January 2005. cwc.gov.in
- Central Water Commission, Central Flood Control Room, Daily flood bulletin: Flood Situation Summary, Bulletin No. 33, 2 June 2021. cwc.gov.in