
Post-monsoon maintenance checklist for river monitoring stations
What to inspect, measure and record at a solar-powered river station once the monsoon has passed, and how to catch slow failures before the next one.

A river monitoring station earns its keep in the monsoon and takes its damage there too. By October it has been through months of rain, humidity, lightning, floods carrying logs and sediment, and cloudy spells in which the solar panel barely kept the battery alive. The problems that end a record next July are usually quiet ones: a mount that has crept a few millimetres, a connector turning green inside its boot, a battery that now holds two-thirds of its original charge. The weeks after the monsoon are the best time to find them. The river is lower, the roads are open, and there are months left to order parts.
Below is a post-monsoon visit for a solar-powered station with a radar sensor, with notes for contact sensors, and a printable checklist.
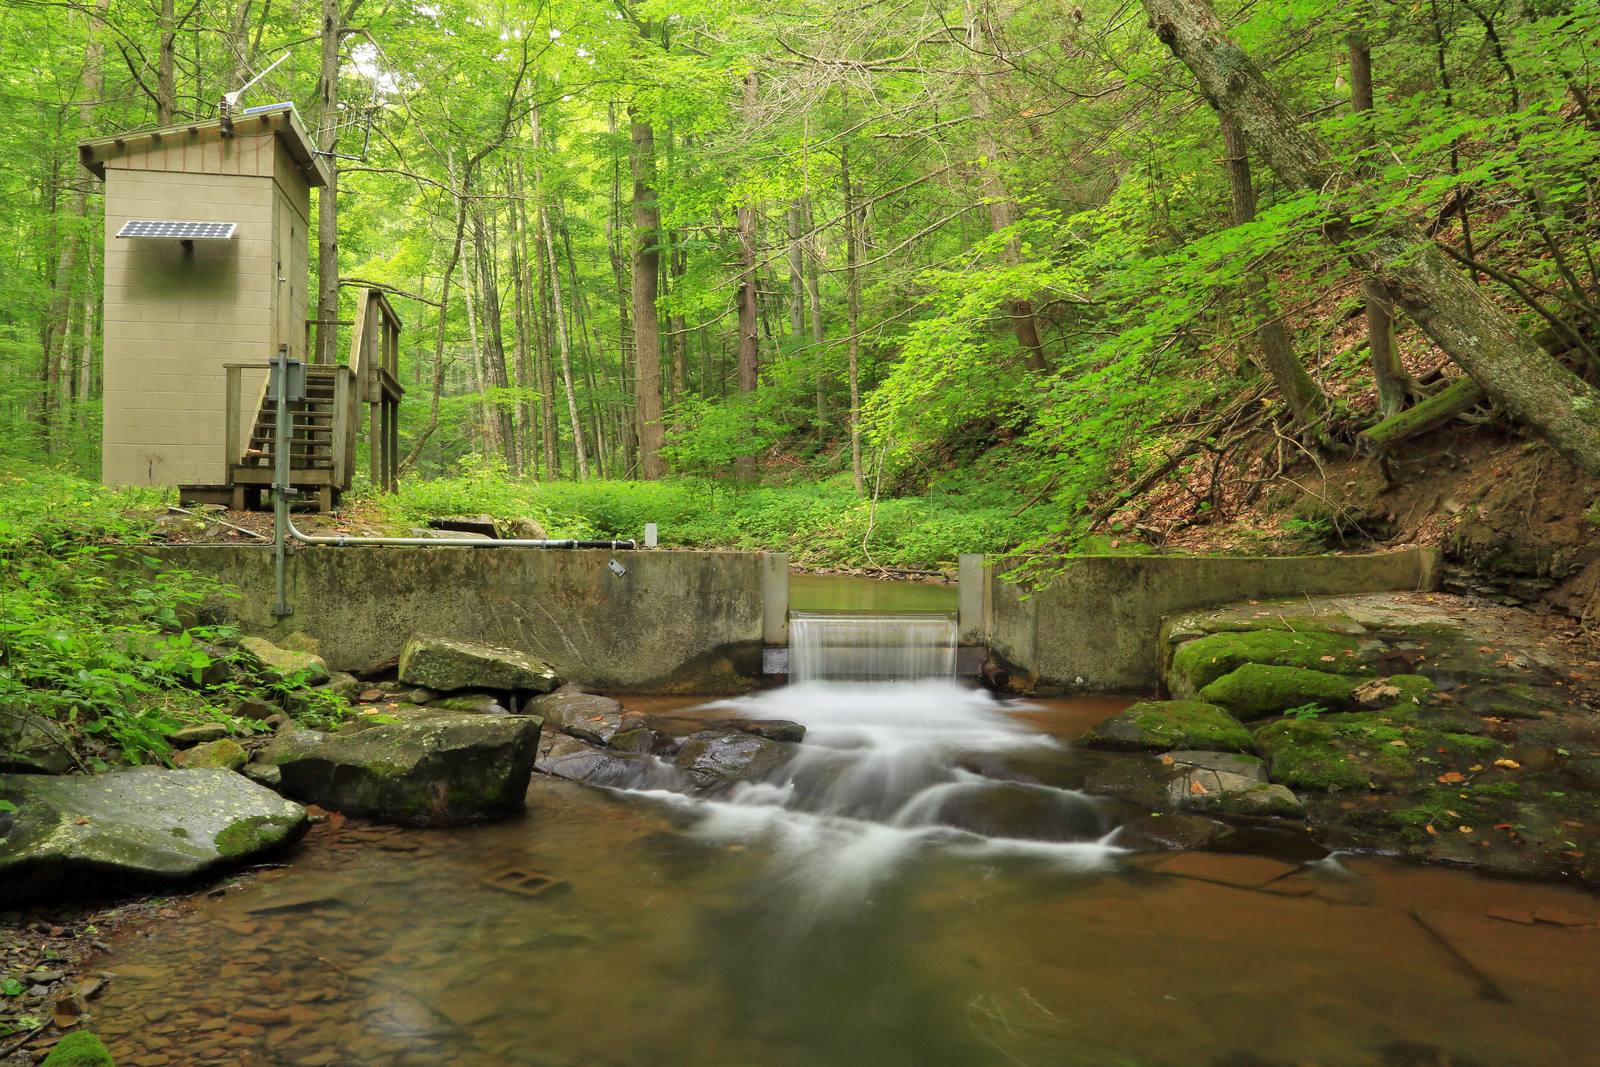
Why a planned visit matters
The WMO Guide to Instruments and Methods of Observation (WMO-No. 8) separates maintenance into corrective (when parts fail), preventive (such as cleaning or lubrication) and adaptive (for changed requirements or obsolescence). It states that data quality "is considerably affected by the quality of its maintenance", and that inhomogeneities in a record (steps or trends that come from the station, not the river) can result from "insufficient routine inspection, maintenance and calibration" [1].
On frequency, the Guide says six months may be appropriate for automatic stations [1]. In India that fits one thorough visit after the monsoon and one before it, plus visits after major floods or faults. The WMO Manual on Stream Gauging (WMO-No. 1044) puts the payoff plainly: experience shows that careful inspection and maintenance result in a complete stage record about 98 per cent of the time [2].
Before you leave the office
Start with the data. The USGS recommends inspecting the record before the visit where possible, because it can reveal problems that cannot be seen at the site [3]. Pull the monsoon record and look for:
- Gaps, and whether they cluster at night, in cloudy spells or in storms (power or link problems).
- Flat lines or spikes (sensor faults, an obstruction under the sensor).
- Steps the river did not make, especially after a flood (a mount or datum that has moved).
- Battery voltage at dawn, the lowest point of each night and the simplest indicator of how close the station came to a brown-out.
- Clock errors and duplicate or out-of-order timestamps.
Worked example: data completeness
Data completeness is the share of expected records actually received.
Logging interval            = 15 min  ->  96 records per day
Monsoon window              = 1 June to 30 September = 122 days
Expected records            = 122 x 96 = 11,712
Records received            = 11,154  (illustrative)
Completeness                = 11,154 / 11,712 = 95.2 %
Missing records             = 558, equivalent to 558 / 96 = 5.8 days
That is below the 98 per cent WMO-No. 1044 describes for well-maintained stations [2]. Now find where the 558 records went: short gaps on cloudy nights point to power, scattered gaps to the link, one block to one event.
Carry the station file (last photographs, gauge readings, wiring diagram), test meters, spares and a camera.
At the site: the order of work matters
The WMO Manual and the USGS give the same opening sequence [2][3]:
- Check the logger clock against an accurate time source and note any error before changing it.
- Read the reference gauge (the staff gauge or other independent gauge the record is checked against) and note the time.
- Read the sensor value for the same moment, and compare the two. If they disagree, find the cause before touching anything else.
- Retrieve the record if it is stored locally.
Only then start cleaning and replacing. The other way round destroys the evidence: once you have cleaned the sensor or reseated a connector, you cannot know whether a difference was there before your visit. If the logger stage is reset, write the time and size of the reset on the form [2].
The USGS notes that staff readings suffer from poor light, very clear water and surge, that surge errors can be reduced by averaging several observations, and that gauges should in almost all cases be read to the nearest 0.01 ft (3 mm) [3]. On a fast hill river, average several readings over a minute and note how rough the water was.
The eight areas to inspect
1. Structure and mounting
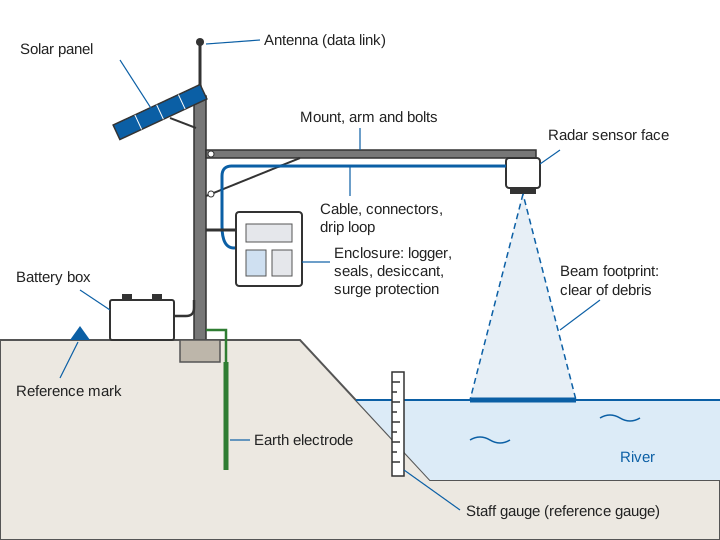
A radar water level sensor measures the distance down to the water, so any movement of its bracket appears directly as an error in stage. Check bolts and clamps for tightness and corrosion, the pole or cantilever for tilt, and the bridge, wall or pier for new cracks or scour.
The USGS notes that uplift or settlement of the supporting structure causes datum errors (errors in the fixed zero that stage is measured from) that can only be found by running levels (a differential survey from fixed reference marks), and that levels are run when a station may have been damaged [3][4]. After a large flood, run them rather than assume nothing moved. The USGS generally does not adjust gauges unless datum discrepancies exceed 0.02 ft (about 6 mm) [3].
Look for high-water marks (debris and mud lines) near the sensor: the WMO and USGS treat them as an independent check on the recorded peak [2][3].
2. The sensor face
Non-contact radar. The USGS checklist for radar stage sensors is short and practical [3]:
- Query the sensor to confirm it is correctly programmed and recording.
- If the horn or radome is open to the air, check it for spider webs, wasp and mud-dauber nests and other insects.
- Check the water surface under the sensor for logs and debris lodged in the footprint, which can build up or draw down the water locally and make the sensor read high or low.
- Check that the beam is not reflecting off a pier or other obstruction.
Compare the scene with last season's photographs for new gravel bars or snags (see radar water level sensing explained for footprint and reflections). Wipe the radome with a damp cloth, without solvents or abrasives unless the manufacturer allows them. A surface velocity radar needs the same footprint check, with the water surface it views clear of new vegetation and debris.
Contact sensors. For a submersible pressure transducer or a bubbler, the main monsoon risk is burial by sediment. The USGS advises querying a transducer to check that slope and offset are correct, and inspecting the orifice or pipe end for sediment [3]. For float gauges, the WMO and USGS call for probing the stilling well, flushing intakes, checking the float, and cleaning intakes and wells at least once a year [2][3]. See radar vs ultrasonic, float and pressure sensors for the trade-offs.
3. Solar panel
The WMO Manual and the USGS both say solar panels should be inspected and cleaned periodically [2][3]. Look for dirt, droppings and moss on the glass, shading from new vegetation, cracked glass or discoloured cells, and a bracket that has turned.
The Manual also says panels and batteries should be sized from the power use of all sensors and recorders and the available sunshine [2]. If a modem, camera or sensor was added during the year, the sizing may no longer hold. Measure charging current at midday in clear sun and compare it with the commissioning value. A drop that cleaning does not restore points to the panel, wiring or charge controller.
4. Battery health
WMO-No. 1044 and the USGS ask for battery voltage to be checked at every visit and the battery replaced if below the specified limit; the Manual adds replacement at the end of its life cycle [2][3]. Voltage alone is a poor guide to remaining capacity: a battery can look healthy at noon while charging and still have lost a third of its capacity. Two measures tell you more:
- The dawn voltage trend: a battery losing capacity reaches lower dawn voltages after each cloudy spell.
- A capacity test: discharge at a known, steady current to the manufacturer's cut-off voltage and measure the ampere-hours delivered. IEC 61427-1 standardises test methods for batteries in off-grid photovoltaic use [5], and IEEE 1188 covers test schedules and when to replace valve-regulated lead-acid batteries [6]. Follow the manufacturer's procedure for rate, temperature and cut-off.
Temperature matters. Laboratory cycling of sealed lead-acid cells gave shorter cycle life at 25 °C and 40 °C than at lower temperatures, as electrode and grid materials degraded faster [7]. A battery box baking in the pre-monsoon sun is ageing the battery, so check shading and ventilation.
Worked example: what capacity loss does to autonomy
Rated capacity                 = 100 Ah at 12 V   (illustrative)
Average station load           = 0.4 A x 24 h = 9.6 Ah per day
Autonomy when new              = 100 / 9.6 = 10.4 days without sun
Capacity measured in October   = 72 Ah
Autonomy now                   = 72 / 9.6 = 7.5 days without sun
A depth-of-discharge limit (the share of capacity the designer allows to be used) reduces both figures in the same proportion. The point is the change: about three days of reserve lost, which may be fine in winter and not enough in a week of monsoon cloud. Replace the battery now, when it costs one visit, not in August, when it costs the record.
Try your own station's numbers below.
5. Cabling and connectors
Walk every cable from sensor to logger. Look for cracked or brittle jackets from sunlight, abrasion on steel edges, and rodent or insect damage (the USGS recommends screening openings against insects, rodents and reptiles [3]). Open a sample of outdoor connectors: green or white deposits on pins mean water is getting in. Clean them and replace damaged seals. Every cable entering the enclosure should have a drip loop below the gland. Inside, check fuses and terminal tightness; a loose battery terminal causes intermittent resets that look like logger faults.
6. Earthing and surge protection
Electronics on poles beside rivers are exposed to monsoon lightning. The USGS describes layered protection [3]: protection built into instruments, surge suppressors on power and communication lines, transient protectors on antenna coaxial cables, protection of sensor lines, and a low-resistance (5-ohm) common-point earth. It also says plainly that a direct strike will likely destroy the electronics anyway [3]. How the protection is designed and the earth tested is covered in lightning and surge protection for remote field stations. After the monsoon:
- Measure earth resistance and compare it with the commissioning value. A rising value means corroded joints or disturbed soil at the electrode.
- Inspect earth conductors and clamps for corrosion, breaks and theft.
- Check surge protection devices; replace any whose status indicator shows end of life.
- Look for scorch marks or swollen components that point to a surge during the season.
7. Enclosure and seals
Moisture is the slow killer of field electronics. The USGS advises keeping equipment clean and ventilated, replacing desiccant (the moisture-absorbing sachets inside the enclosure) and keeping humidity down [3]. Check the door gasket (flattened, torn or hardened rubber no longer seals), cable glands, signs of ingress (stains, condensation, rusty screws), the desiccant, and vents. Photograph the inside every visit: corrosion invisible from one visit to the next is obvious across four photographs.
8. Data link and data completeness
Compare signal strength with earlier visits. A drop can mean a damaged cable or connector, a turned antenna or a change at the network end. Confirm that transmissions arrive on schedule, that server data match the logger, and that the logger holds data for any period the link was down. For link design, see telemetry link design for hydromet stations.
What to record at every visit
The WMO Guide asks for a prepared form at every inspection, and for all changes to be recorded and dated so that a station history can be built [1]. A practical site log contains:
- Date, times, names, and logger clock error before correction.
- Reference gauge and sensor readings, with times, before and after work.
- Battery voltage (resting and charging), charging current, earth resistance, signal strength.
- Everything cleaned, adjusted or replaced, with serial numbers of new parts.
- Any reset of stage, with time and size [2].
- Photographs from fixed points: upstream, downstream, sensor footprint, staff gauge, mount, solar panel, open enclosure.
Both manuals end the visit the same way: after all other work, make a final complete set of readings and confirm all instruments are working before leaving [2][3].
Spotting slow problems
Single readings rarely reveal a problem; trends across visits do.
| Slow problem | What to compare across visits | Warning sign |
|---|---|---|
| Sensor drift or mount movement | Sensor minus reference gauge, every visit | A steady trend, or a step after a flood |
| Battery capacity loss | Dawn voltage after cloudy spells; capacity test | Lower dawn voltages each season; capacity falling |
| Solar degradation or shading | Midday charging current in clear sun | Lower current that cleaning does not restore |
| Water ingress | Enclosure photographs, desiccant state | Stains, rust, desiccant saturated quickly |
| Connector corrosion | Connector inspection, intermittent faults | Resets, noisy or dropped readings |
| Earthing degradation | Earth resistance readings | Value rising year on year |
Worked example: reading the reference comparison
Suppose a station has these differences, sensor stage minus staff gauge reading, taken during calm conditions (illustrative values):
| Visit | Difference (mm) |
|---|---|
| January | +1 |
| March | +2 |
| May | +2 |
| October | +9 |
| December | +11 |
Before the monsoon the difference changes by about 1 mm in four months, close to how well a staff can be read. Between May and October it jumps by 7 mm (9 − 2), more than the 0.02 ft (about 6 mm) datum discrepancy below which the USGS generally leaves a gauge unadjusted [3]. A step in the flood season points to something physical: a slipped bracket or a staff gauge knocked by debris. Run levels to the reference marks to find which one moved; how the marks, the staff gauge and the sensor are tied to gauge zero is explained in gauge zero, datum and benchmarks. If the further rise to December continues, suspect gradual movement or drift. The correction itself is applied from the date of the step (visible in the data), not the date of the visit, and a slow drift is prorated between visits, as set out in data quality control for hydromet time series.
The sensor tells you where the water is relative to the sensor. Only the reference gauge and levels tell you whether the sensor is still where you think it is. Stage errors carry straight into discharge, as explained in rating curves and their uncertainty.
Printable checklist
| Area | Check | Record |
|---|---|---|
| Before visit | Review monsoon record: gaps, steps, spikes, dawn battery voltage, clock | Completeness %, list of events |
| Arrival | Logger clock vs accurate time | Clock error |
| Arrival | Reference gauge and sensor readings at the same time | Both readings, time, water condition |
| Structure | Bolts, clamps, pole tilt, cracks, scour, high-water marks | Photos, high-water mark heights |
| Structure | Run levels if a flood may have moved anything | Level closure, datum differences |
| Sensor (radar) | Programming, horn or radome clean, no nests, footprint clear, no pier reflection | Photos of footprint |
| Sensor (contact) | Orifice or transducer not buried, slope and offset, intakes flushed | Findings, cleaning done |
| Solar | Clean, no cracks or shading, bracket secure | Midday charging current |
| Battery | Terminals, case, temperature, voltage; capacity test if due | Voltages, Ah measured |
| Cabling | Jackets, abrasion, animal damage, connector corrosion, drip loops | Items repaired |
| Earthing and surge | Earth resistance, conductors, surge device status | Earth resistance in ohms |
| Enclosure | Gasket, glands, ingress signs, desiccant, vents | Inside photo, desiccant replaced |
| Data link | Signal strength, transmissions, server vs logger match | Signal level |
| Departure | Final full set of readings, all instruments working | Readings, departure time |
Key points
- Read the record before the visit. Gaps, steps and dawn battery voltages show most problems before you arrive.
- At the site, check the clock and compare the sensor with the reference gauge before touching anything.
- The mount is part of the measurement. After big floods, run levels rather than assume nothing moved.
- Judge batteries by capacity and dawn voltage trends, not by a single voltage reading.
- Earthing, seals and connectors fail slowly. Measure, photograph and compare them every visit.
- Keep a dated site log with fixed-point photographs. Trends across visits reveal what one visit cannot.
At ClimMaTech we build and look after solar-powered river stations in Himalayan catchments, where the monsoon is hard on equipment, and this checklist reflects how we plan those visits. Our river monitoring solution brings together Tarang, a radar automatic water level recorder (AWLR), and PRAVAAH, which combines an AWLR with a surface velocity radar (SVR), and our AWLR and AWVLR guide covers how such stations are put together.
References
- World Meteorological Organization, Guide to Instruments and Methods of Observation, Volume V: Quality Assurance and Management of Observing Systems, WMO-No. 8, 2024 edition, Chapter 1 (sections 1.6 Factors affecting data quality, 1.9 Data homogeneity, 1.10.1 Inspections). WMO publication page.
- World Meteorological Organization, Manual on Stream Gauging, Volume I: Fieldwork, WMO-No. 1044, 2010, Chapter 4, sections 4.2 (verification), 4.7.4 (power requirements) and 4.8 (operation of stage measurement stations). old.wmo.int (PDF).
- V. B. Sauer and D. P. Turnipseed, Stage Measurement at Gaging Stations, U.S. Geological Survey Techniques and Methods 3-A7, 2010 (sections on datum errors, gage-reading errors, lightning protection and operation of stage-measurement stations). pubs.usgs.gov.
- T. A. Kenney, Levels at Gaging Stations, U.S. Geological Survey Techniques and Methods 3-A19, 2010. pubs.usgs.gov.
- International Electrotechnical Commission, IEC 61427-1:2013, Secondary cells and batteries for renewable energy storage – General requirements and methods of test – Part 1: Photovoltaic off-grid application, IEC, 2013. webstore.iec.ch.
- IEEE, IEEE 1188-2005, Recommended Practice for Maintenance, Testing, and Replacement of Valve-Regulated Lead-Acid (VRLA) Batteries for Stationary Applications (with Amendment 1188a-2014, Amendment 1: Updated VRLA Maintenance Considerations), IEEE Standards Association, 2005. standards.ieee.org.
- U. Prasad, J. Prakash, A. N. M. Kannan, V. Kamavaram and G. K. Arumugam, Failure analysis of lead-acid batteries at extreme operating temperatures, Battery Energy 2(4), 20230008, 2023. doi:10.1002/bte2.20230008.