
Sentinel-1 flood mapping: floods from space with radar
How radar satellites see through monsoon cloud to show where floodwater has spread, how the maps are made, and where they can mislead.

When a river breaks its banks during the monsoon, the sky is usually covered in cloud, and an ordinary satellite photograph shows nothing but white. Yet district officials still need to know which villages, fields and roads are under water. Sentinel-1 flood mapping answers that question by using radar instead of light. It can map flood extent day or night, through cloud, from a satellite that is free to use. This article explains how it works, how a flood map is made, how India's own agencies use it, and what the maps cannot tell you.
Why use radar to map floods?
Radar works because it does not depend on sunlight or clear skies. Sentinel-1 is a radar satellite mission of the European Union's Copernicus programme, operated with the European Space Agency (ESA). Its instrument is a synthetic aperture radar (SAR), which sends its own microwave pulses at the ground and records the echo. It works at C-band, a centre frequency of 5.405 GHz (wavelength about 5.55 cm), and can observe "at any time of the day or night, regardless of weather and environmental conditions" [1].
Two practical features matter for floods. First, the main land mode, Interferometric Wide swath (IW), covers a 250 km wide strip at about 5 m by 20 m resolution, and its products are normally resampled to 10 m pixels [1][8]. Second, the data are free: the Copernicus policy gives "free, full and open access" to Sentinel data [2].
Revisit time is the main limit. ESA gives an exact repeat of six days for a two-satellite constellation, and about three days at the equator because neighbouring orbits overlap [1]. Sentinel-1B, for example, stopped delivering radar data in December 2021, and replacement satellites have been launched since [1].
How does Sentinel-1 detect floodwater?
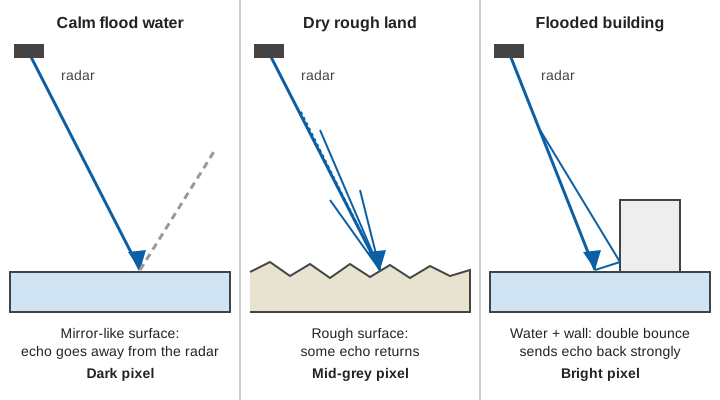
Sentinel-1 detects floodwater because calm water is a poor reflector of radar towards the satellite. The radar looks sideways, at an angle. A calm water surface acts like a mirror: the pulse bounces away from the sensor, and very little energy returns. ESA's user pages describe calm open water as "flat" to C-band radiation, which gives low backscatter that contrasts sharply with surrounding land [3]. Backscatter is simply the fraction of the transmitted energy that returns to the antenna. In an image, water therefore appears dark.
Sentinel-1 records two polarisations over land, VV and VH. Polarisation is the orientation of the radar wave: VV means vertical transmitted and vertical received, VH means vertical transmitted and horizontal received [1]. In the DLR (German Aerospace Center) processing chain, VV was slightly more accurate than VH under calm wind [5]. ESA recommends using both, because together they help to detect flooded vegetation [3].
A real example of the numbers
In a study of the August 2018 Kerala floods, Tiwari and co-authors processed Sentinel-1 VV scenes on a cloud-based platform, applied a 5 × 5 Lee speckle filter, and found that water pixels averaged about −23.5 dB while non-water averaged about −8.8 dB [6]. Decibels (dB) are a logarithmic scale for backscatter; lower, more negative values mean weaker echoes. A dividing line halfway between those two values lies near −16 dB. The authors let an automatic method, Otsu thresholding, choose the line from the histogram, and reported overall accuracies of about 94 % for 9 and 21 August 2018 [6].
How is a Sentinel-1 flood map made?
A flood map is made by turning each radar pixel into "water" or "not water", then clipping out what is normally water. The UN-SPIDER recommended practice, uses the ESA SNAP software on Level-1 Ground Range Detected (GRD) scenes [7][8]:
- Download a scene taken during the flood from the Copernicus Data Space Ecosystem, and ideally one from before it.
- Calibrate the image so that pixel values are backscatter (sigma-nought) and comparable between dates.
- Filter speckle. Radar images have grain-like noise called speckle; the guide uses a 7 × 7 Lee filter [8].
- Correct the terrain. Range-Doppler terrain correction with an elevation model puts each pixel in its true map position, at 10 m spacing [8]. The choice of elevation model matters: errors in it shift pixels and distort the shadow and layover masks.
- Threshold. Pixels below a chosen backscatter value become water. The Malawi example in the guide uses 0.0222 in linear units, which is about −16.5 dB [8].
- Remove permanent water. The UN-SPIDER example stops after thresholding and notes false positives around water bodies [8]; subtracting the rivers, lakes and reservoirs seen in the pre-flood image leaves the flooded area.
Automatic systems do the same. The DLR chain needs no user input and delivers flood information within about 45 minutes of new data appearing; it was tested at two sites on the Greece-Turkey border with overall accuracy of 94.0 to 96.1 % [5]. The Copernicus Global Flood Monitoring system maps each new Sentinel-1 image worldwide. It runs three independent algorithms and combines them into one extent map with a flood likelihood for each pixel [9].
From pixels to hectares (illustrative)
Suppose a classified scene has 36,000 flood pixels, each 10 m × 10 m:
Area per pixel = 10 m × 10 m = 100 m²
Flooded area   = 36,000 × 100 m² = 3,600,000 m² = 3.6 km² = 360 ha
Such figures depend on pixel size and on which pixels the scene covers. NRSC's own district tables carry the warning that the area "is dependent on spatial resolution of satellite sensor and satellite coverage" [10].
How does India map floods from satellites?
India's National Remote Sensing Centre (NRSC) of ISRO maps floods in near real time as a standing service. It publishes the resulting layers through its Bhuvan and NDEM portals [10]. NRSC uses both its own satellites and Sentinel-1, and the mix changes from event to event.
Two NRSC documents show the practice:
- Andhra Pradesh, October 2025. After heavy rain from Cyclone Montha, NRSC acquired RISAT-1A radar data on 26 October 2025, rectified it to a reference image, and extracted the water layer from the change in backscatter between pre- and post-event data. It reported 28,003 ha affected across four districts, noting that satellite coverage was only partial in all four. Its earlier pass list for the 2025 floods also includes Sentinel-1A scenes [10].
- Uttar Pradesh, July 2024. A rapid-mapping sheet used radar data from 20 May 2024 as the pre-flood reference and an optical image from 10 July 2024 as the flood scene, with a cloud class marked on the map [11].
Both documents carry the same honest caveat: the mapped water "may include" rain water accumulation in low-lying areas [10][11], and the Uttar Pradesh sheet adds that it gives preliminary results and "No ground verification is done" [11]. Our post on flood hazard maps and floodplain zoning shows how repeated event maps feed longer-term hazard maps.
Where does Sentinel-1 flood mapping go wrong?
Flood maps from Sentinel-1 go wrong wherever a flood does not make the radar image darker, or where something else does. The UN-SPIDER guide lists the main failures: shadow on variable terrain, smooth objects such as roads and sand, flooded urban areas, and flooded vegetation [7]. In more detail:
- Radar shadow and layover. A side-looking radar cannot see the far side of a steep slope (shadow) and folds the near side onto the far side (layover). Terrain correction repairs foreshortening but cannot recover shadow or layover pixels, which are left with no data [12]. Shadow also looks dark, like water. In steep valleys this is a serious problem, and it is why a Himalayan flood map needs a shadow and layover mask.
- Towns. Walls and roofs produce bright, complicated echoes. Floodwater beside a wall can give a double bounce that is brighter than before, so a flooded street can look more built-up rather than darker [4][7].
- Vegetation. C-band radar mostly scatters from the top of the canopy, so flooded crops and forest are poorly seen. Using VV and VH together, or two dates, helps [3][7].
- Wind and rain. A rough water surface scatters more energy back and may not look dark; accuracy was higher under calm wind [5].
- Lookalikes. Sand, tarmac and wet-season shadow all resemble water. In one UK and Italian study, the authors mapped "exclusion areas" such as shadow, layover, towns and dense vegetation, where floodwater has little effect on backscatter, and found that this layer agreed with reference data about 63 % of the time. That is a reminder that the exclusion map is a guide, not a certainty [4].
- Timing. At a revisit of several days, a satellite can miss a flash flood altogether. Rivers in hill catchments rise and fall within hours; see flash floods vs river floods and river monitoring in hill and Himalayan catchments.
Context matters as much as imagery. In our analysis of the July 2023 Himachal floods, we found that the flood peak was driven by extremely heavy rain falling on nearly saturated soil, combined with snowmelt, which a single map of the flooded area cannot show [13].
Radar from space and sensors on the ground
A flood map and a river gauge answer different questions. The satellite gives wide coverage and the flooded footprint, a few days apart. A gauge gives the river's level every few minutes at one place. Satellite extent has no warning value by itself, because the picture arrives after the water. The two work best together: the gauge shows the level and rate of rise, the map shows what that level meant on the ground. For the ground-based half, see how radar water level sensing works and how a flood early warning system works.
Key points
- Sentinel-1 is a C-band radar satellite. It sees through cloud and at night, and its data are free [1][2].
- Calm water reflects the beam away, so it appears dark; flood maps are made by thresholding or change detection on that signal [3][7].
- A typical workflow is calibrate, filter speckle, correct terrain, threshold, then remove permanent water [8].
- Published tests report overall accuracies of about 94 to 96 %, but towns, vegetation, steep terrain, wind and sand are known weak spots [5][6][7][12].
- NRSC's rapid flood maps may include standing rainwater, and the Uttar Pradesh sheet notes that no ground verification is done [10][11].
- A satellite revisits every few days, so it maps the aftermath; it does not warn.
Where ClimMaTech fits
Satellite maps show where floodwater has been; early warning needs measurements at the river before the water arrives. At ClimMaTech we build the ground side: radar river-level and surface-velocity stations that report under good network conditions. They give the local record that a satellite pass cannot. Our flood warning solution page describes how these stations fit with maps and warning dissemination.
References
- European Space Agency / Copernicus, Sentinel-1 Mission, SentiWiki, accessed 2026. sentiwiki.copernicus.eu
- European Space Agency, Free access to Copernicus Sentinel satellite data, 15 November 2013. esa.int
- European Space Agency / Copernicus, Sentinel-1 Applications, SentiWiki. sentiwiki.copernicus.eu
- J. Zhao, M. Chini, R. Pelich, P. Matgen, R. Hostache, S. Cao, W. Wagner, Deriving exclusion maps from C-band SAR time-series: an additional information layer for SAR-based flood extent mapping, ISPRS Annals V-1-2020, 395–400, 2020. doi:10.5194/isprs-annals-V-1-2020-395-2020
- A. Twele, W. Cao, S. Plank, S. Martinis, Sentinel-1-based flood mapping: a fully automated processing chain, International Journal of Remote Sensing 37(13), 2990–3004, 2016. doi:10.1080/01431161.2016.1192304
- V. Tiwari, V. Kumar, M. A. Matin, A. Thapa, W. L. Ellenburg, N. Gupta, S. Thapa, Flood inundation mapping, Kerala 2018: harnessing the power of SAR, automatic threshold detection method and Google Earth Engine, PLOS ONE 15(8): e0237324, 2020. doi:10.1371/journal.pone.0237324
- UN-SPIDER, United Nations Office for Outer Space Affairs, Recommended practice: flood mapping and damage assessment using Sentinel-1 SAR data in SNAP. un-spider.org
- UN-SPIDER, Recommended practice: flood mapping, step-by-step. un-spider.org
- C. Krullikowski et al., Estimating ensemble likelihoods for the Sentinel-1 based Global Flood Monitoring product of the Copernicus Emergency Management Service, arXiv:2304.12488 (preprint), 2023. arxiv.org
- National Remote Sensing Centre, ISRO, Andhra Pradesh Floods 2025: near real time water inundation mapping using satellite data, Ref. 2025/FL/AP/10, 27 October 2025. apsac.ap.gov.in
- National Remote Sensing Centre, ISRO, Flood inundation areas in parts of Uttar Pradesh state, Map 2024/FL/UP/04/10072024, 11 July 2024. ndem.nrsc.gov.in
- Alaska Satellite Facility, Sentinel-1 RTC product guide (foreshortening, layover and shadow). hyp3-docs.asf.alaska.edu
- V. Gupta, B. Syed, A. Pathania, S. Raaj, A. Nanda, S. Awasthi, D. P. Shukla, Hydrometeorological analysis of July-2023 floods in Himachal Pradesh, India, Natural Hazards 120(8), 7549–7574, 2024. doi:10.1007/s11069-024-06520-5