
Flood hazard maps in India and floodplain zoning
How a flood hazard map is made, what the flood zones mean, and why zoning law has been slow to reach the floodplain.

A family buys a plot a short walk from a river. It has not flooded in living memory, but nobody can say whether the river once reached it. A flood hazard map India can answer that before the foundation is dug, and floodplain zoning turns the answer into a rule about what may be built where. This article explains how the maps are made, how Indian guidance defines the zones, and where the system has stalled.
What is a flood hazard map?
A flood hazard map shows where a flood of a stated probability would reach and how severe it would be there. The usual layers are the extent of flooding, the depth of water, and sometimes the velocity. Each map belongs to one return period: the average interval between floods of that size or larger. A 25-year flood has a 1-in-25 chance, or 4 %, of being equalled or exceeded in any year.
The chance of at least one such flood in n years is:
P = 1 − (1 − 1/T)^n T = return period (years), n = period considered (years)| Return period T | Chance in any one year | Chance in 30 years (illustrative: a typical mortgage) |
|---|---|---|
| 5 years | 20 % | 1 − 0.8^30 = 99.9 % |
| 25 years | 4 % | 1 − 0.96^30 = 70.6 % |
| 100 years | 1 % | 1 − 0.99^30 = 26.0 % |
Land inside the 5-year line will almost certainly be wet within 30 years; one building in four on the 100-year line will see its flood.
A flood risk map goes one step further. Hazard is only the water. Risk combines the hazard with exposure (what is there: people, houses, roads, crops) and vulnerability (how badly they are hurt). A river that floods an empty meadow every year is a high hazard and a low risk.
How is a flood hazard map made using GIS?
A flood hazard map is built by estimating the flood flow for a chosen return period, routing it through a hydraulic model of the valley, and mapping the computed water surface onto the ground in a GIS (geographic information system). The steps are:
- Choose the design flood. Flows for 5-, 25- and 100-year events come from gauge records or, where records are short, from rainfall-runoff models. See hydrological models explained and intensity-duration-frequency curves.
- Describe the ground. A digital elevation model (DEM), a grid of ground heights, supplies the valley shape. River sections surveyed in the channel add what the DEM cannot see below the water; see river cross-section surveys.
- Run a hydraulic model. A one-dimensional model computes water level along the river. A two-dimensional model spreads water over the floodplain and gives depth and velocity at each cell. Roughness (Manning's n) is set from land cover and tuned against observed levels.
- Intersect and map. The computed water surface is subtracted from the DEM. Where the water is higher than the ground, the cell is flooded, and its depth is stored.
- Check against evidence. Flood marks on walls, surveyed high-water lines, satellite images of past floods and gauge records are compared with the model.
The National Disaster Management Authority (NDMA) guidelines on Management of Floods ask for maps at 1:10,000 or 1:15,000 with contours at 0.3 m or 0.5 m intervals, marked with reference river gauges so that the area inundated at each stage can be read off [1]. The Central Water Commission (CWC) began a programme of such surveys in 1978 through the Survey of India. By 2008 about 55,000 km² of the roughly 106,000 km² identified as frequently flood-prone had been surveyed, in seven states and union territories [1]. The guidelines record that the states had not finalised or published the resulting zone maps [1].
Satellite mapping offers a second route. The National Remote Sensing Centre (NRSC) has produced district-wise flood hazard atlases from many years of satellite images of past floods; its Bihar atlas draws on images from 1998 to 2010 and was peer reviewed by a committee constituted by NDMA [5]. Satellite images show where water went; a model says how deep and what a rarer flood would do.
How good is the elevation data?
The DEM often decides how good the map is. In the Godavari basin, Sharma and Regonda ran a two-dimensional model for three floods with two DEMs (30 m and 90 m), two roughness sets and two ways of setting the upstream boundary. Simulated water levels correlated with observations at more than 0.85 on average, and the best of the six cases reached 0.95 [6]. The best case paired the 90 m DEM with tuned roughness, so the inputs mattered as much as the model.
Global DEMs also carry errors that vary from place to place. Hawker and co-authors simulated plausible versions of a global DEM and ran a flood model on the ensemble; for the best-performing ensemble the inundation estimates were closer to a LiDAR benchmark than those from a single deterministic DEM [7].
What is a flood hazard rating?
Depth alone is not the whole hazard. A knee-deep slow flow is a nuisance; the same depth at 3 m/s can sweep a person off their feet. A widely used measure from the UK flood research programme combines both, with an allowance for debris [8]:
HR = d × (v + 0.5) + DF
d = depth (m), v = velocity (m/s), DF = debris factor (0, 0.5 or 1)

Class:  HR < 0.75 low | 0.75–1.25 moderate | 1.25–2.5 significant | > 2.5 extreme
The debris factor depends on depth, speed and land use: for example 0 for pasture at depths up to 0.75 m, and 1 for urban land at any depth over 0.25 m [8]. The class limits are British, not Indian standards; the principle carries over.
Illustrative example. Three points on one floodplain in the same flood:
| Point | Land use | d (m) | v (m/s) | DF | HR | Class |
|---|---|---|---|---|---|---|
| A | pasture | 0.3 | 0.3 | 0 | 0.3 × 0.8 + 0 = 0.24 | Low |
| B | urban street | 0.6 | 1.5 | 1 | 0.6 × 2.0 + 1 = 2.2 | Significant |
| C | woodland terrace beside a hill stream | 1.0 | 3.0 | 1 | 1.0 × 3.5 + 1 = 4.5 | Extreme |
Point C has less than twice the depth of B and more than twice its hazard. In steep Himalayan valleys, velocity and debris, not depth, usually decide the damage; see debris flows in Himalayan streams and river monitoring in hill catchments.
What is floodplain zoning, and what are the flood zones?
Floodplain zoning is the control of land use in the flood plain so that flood damage is kept to a minimum. In the NDMA guidelines, it fixes where development may take place and how far, limits growth in both protected and unprotected areas, and does not remedy what has already been built [1]. The hazard map supplies the lines; zoning gives them legal force.
The NDMA guidelines tie land use to return period [1]:
- Up to the 10-year flood: keep for gardens, parks and playgrounds. No residential, public, commercial or industrial buildings.
- Up to the 25-year flood: residential buildings may be permitted on stilts or columns, with minimum plinth levels, no basements and minimum levels for approach roads.
- Critical facilities such as hospitals, power installations, water supply, telephone exchanges, aerodromes and railway stations should sit above the 100-year level or the maximum observed flood. Public offices, universities and residential areas should be above the 25-year level.
- Bye-laws: plinths at least 0.6 m above the flood submersion line and multi-storey buildings preferred [1].
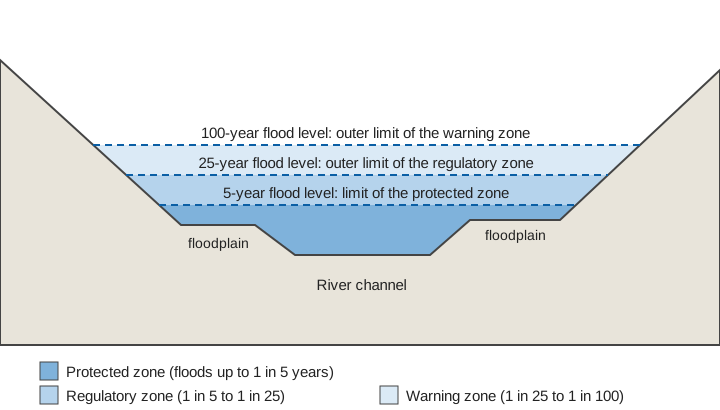
In 2025 the Ministry of Jal Shakti circulated CWC's Technical Guidelines on Flood Plain Zoning to states and Union Territories. As news reports of August 2025 describe them, they define three zones by return period: a protected zone for floods up to 1 in 5 years where permanent construction is banned apart from essential public works, a regulatory zone between 1 in 5 and 1 in 25 where activities are regulated, and a warning zone between 1 in 25 and 1 in 100 where most activities can proceed once vulnerability is mapped. Each state or Union Territory is to name a nodal agency to map flood-prone areas with satellite data and hydrological modelling, and the reports mention special provisions for hilly and Himalayan areas, including cloudbursts and glacial lake outburst floods [2][3].
Why do so few states have a floodplain zoning law?
India circulated a model bill in 1975, and most states have never enacted it. The model Flood Plain Zoning Bill provides for a Flood Zoning Authority for each river, and for a survey of the river with charts and registers that fix the boundaries of the zones [1]. Land and flood management are state subjects, so the Centre can only advise.
The NDMA guidelines record the result in 2008. Manipur had enacted a law in 1978 but had not demarcated flood zones, and Rajasthan had legislated without enforcing it. Assam, Goa, Himachal Pradesh and Sikkim, among others, said they had not considered such legislation [1]. The guidelines blame population pressure and the lack of alternative livelihoods, note encroachment into flood plains sometimes approved by town-planning authorities, and asked states to legislate by March 2009 [1]. In 2025, press reports on the new guidelines still counted only four states and territories as having complied: Manipur, Rajasthan, Uttarakhand and the erstwhile Jammu and Kashmir [2][3].
Researchers at the Observer Research Foundation list further difficulties: the model bill states no governance objective, the Flood Zoning Authority has no defined resources or coordination with other agencies, resettling residents is hard, and embankments create a false sense of security that invites building on the protected side [4].
Maps are not fixed: the limits to remember
- The line moves. A flood zone depends on the flow statistics, the channel and the ground. Channels shift, beds rise with sediment, and new embankments or bridges change levels. A map needs revisiting, especially after a large flood.
- Climate may shift the return periods. In our study of 128 Indian basins using CMIP6 climate models, the projections pointed to more frequent and longer high-flow events in a changing climate [9]. A line drawn from past records may understate future floods.
- A river-flood map is not a map of every flood. Cloudbursts, debris flows and glacial lake outbursts need their own treatment; see glacial lake outburst floods.
- Zoning cannot fix existing risk. For people already in a hazard zone, warning matters; see how a flood early warning system works.
Key points
- A flood hazard map shows extent, depth and sometimes velocity for a flood of a stated return period; a flood risk map adds exposure and vulnerability.
- Maps come from design flows, a DEM, a hydraulic model and GIS, and are checked against observed levels and satellite images. DEM and roughness choices can change results as much as the model.
- Indian guidance links land use to return period: 5- or 10-year land kept open, 25-year land restricted, and critical facilities above the 100-year level.
- The 1975 model bill remains unenacted in most states, which leaves the maps without legal force.
- Measured river levels are what keep a mapped zone honest.
Where ClimMaTech fits
A flood hazard map is a statement about water levels that may or may not match what the river does. Gauge records are how those statements are tested and updated, and how a zoned floodplain is warned when the river rises. At ClimMaTech we build river monitoring and early-warning systems, and our flood warning solution page describes how level and velocity readings feed alerts for the communities that live behind the lines on the map.
References
- National Disaster Management Authority, Government of India, National Disaster Management Guidelines: Management of Floods, 2008 (chapter 6 and Annex VI/I, Model Bill for Flood Plain Zoning). ndma.gov.in
- Press Trust of India, Centre issues floodplain zoning guidelines, bans high-risk activities, enforces river buffer, The Week, 13 August 2025. theweek.in
- Centre issues floodplain zoning guidelines, bans high-risk activities, Kashmir Reader, 14 August 2025. kashmirreader.com
- S. Modak, P. Kapuria, Floodplain zoning in India, ORF Occasional Paper No. 248, Observer Research Foundation, 2020. orfonline.org
- National Remote Sensing Centre (ISRO), Flood Hazard Zonation Atlas. nrsc.gov.in
- V. C. Sharma, S. K. Regonda, Two-dimensional flood inundation modeling in the Godavari River Basin, India: insights on model output uncertainty, Water 13(2), 191, 2021. doi:10.3390/w13020191
- L. Hawker, J. Rougier, J. Neal, P. Bates, L. Archer, D. Yamazaki, Implications of simulating global digital elevation models for flood inundation studies, Water Resources Research, 2018. doi:10.1029/2018WR023279
- HR Wallingford, Flood Hazard Research Centre and Risk & Policy Analysts for Defra and the Environment Agency, Flood Risks to People, Phase 2, FD2321/TR1: The Flood Risks to People Methodology, March 2006. gov.uk
- V. Sharma, S. Barbhuiya, V. Gupta, Projections of future streamflow for India informed by CMIP6 global climate models, Hydrological Processes 40(3), e70476, 2026. doi:10.1002/hyp.70476