
Reservoir level monitoring: what dam operators need to measure, and why
The levels that define a reservoir, the elevation–area–capacity curve that turns level into storage, and why a continuous level record changes what an operator can see and do during a flood.

On a monsoon night a reservoir operator has a few questions to answer. How much water is coming in? How much room is left before the full reservoir level? How fast should the gates open, and who downstream needs to know? Almost every one of those answers starts from a single number: the water level at the dam. This article explains the levels that define a reservoir, how level becomes storage and inflow, how siltation changes that conversion, and why one or two readings a day are not enough in a flood.
The levels that define a reservoir
Indian practice uses a standard set of levels, defined in the Bureau of Indian Standards (BIS) codes on reservoir operation and reservoir capacities [1][2]. Each is an elevation, usually in metres above mean sea level.
- Full reservoir level (FRL). "The highest reservoir level which can be maintained without spillway discharge or without passing water through under sluices", also called the highest controlled water level [1].
- Maximum water level (MWL). The level likely to be reached at the dam face while passing the adopted design flood, also called the highest flood level or spillway design flood level [1].
- Minimum drawdown level (MDDL). The lowest level to which the reservoir may be drawn down to meet various needs. In hydropower projects releases are made only down to the MDDL, to keep the minimum head that the turbines need [1].
- Dead storage level (DSL). The level of the lowest outlet. Water below it cannot be released by the normal outlets. IS 5477 notes that dead storage is generally occupied by silt and sediment [1][2].
Between these levels lie the storage zones. Live storage runs from the MDDL (or the lowest outlet) up to the FRL [1]. Surcharge storage runs from the FRL to the MWL and is only used while passing a flood [2]. Buffer storage sits between the DSL and the MDDL and is released only for essential needs in dry conditions. Dead and buffer storage together make up the inactive storage [2].
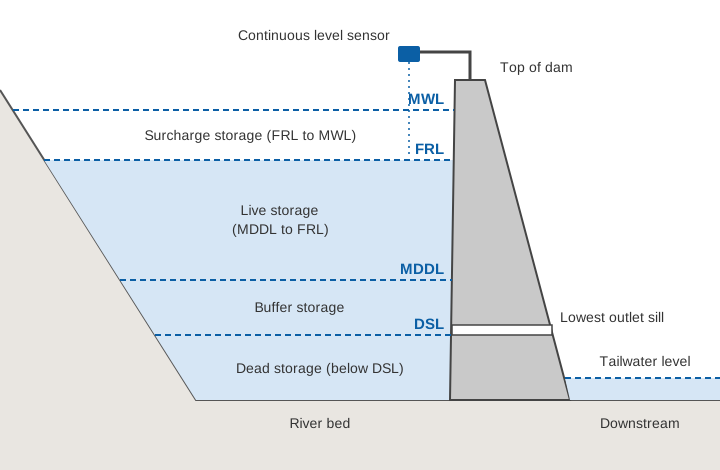
The CWC's guidelines for dam operation and maintenance (O&M) manuals ask every manual to list these levels, outlet sills and spillway crest, with the storage at each [4]. One worked example in those guidelines, for Barna Dam in Madhya Pradesh, gives an FRL of 348.55 m and an MWL of 351.45 m, and notes that the band between them can absorb 289 million m³ during a flood [4].
The elevation–area–capacity curve
A level is not a volume. To turn one into the other, every reservoir has an elevation–area–capacity curve (also called the area-capacity table or level–storage curve). It gives two numbers for each elevation: the area of the water surface, and the capacity, which is the volume stored below that level. IS 5477 describes the two curves as plots of elevation against surface area and elevation against volume, and says they should be based on a topographic survey of the reservoir area [2].
The two are linked. A thin slice of water of thickness Δh at a level where the surface area is A has a volume of about A × Δh. Capacity is the sum of all those slices from the bed upward:
Capacity(h) = ∫ A(z) dz   (from the bed up to h)

ΔS ≈ A(h̄) × Δh     for a small change in level, where h̄ is the mean level
Because valleys widen upward, each metre near the top holds far more water than a metre near the bed. The CWC weekly bulletin for 20 March 2025 listed Gobind Sagar (Bhakra) at 476.62 m against an FRL of 512.06 m: about 35 m below full, yet still holding 1.417 of its 6.229 billion m³ of live capacity, about 23 % [7]. Without the curve, "35 m down" tells you very little about the water available.
The table below is an illustrative reservoir that we use throughout this article. Areas are invented for teaching. Capacities are computed from the areas by the formula above.
| Elevation (m) | Water-surface area (km²) | Capacity (million m³) | Level |
|---|---|---|---|
| 400 | 0 | 0 | River bed |
| 410 | 1.0 | 5.0 | |
| 415 | 2.0 | 12.5 | DSL |
| 420 | 3.0 | 25.0 | MDDL |
| 430 | 6.0 | 70.0 | |
| 440 | 10.0 | 150.0 | |
| 445 | 12.5 | 206.3 | FRL |
| 448 | 14.0 | 246.0 | MWL |
In this example the live storage (MDDL to FRL) is 181 million m³ and the surcharge storage (FRL to MWL) is about 40 million m³. The top 5 m below the FRL alone hold 56 million m³, more than twice the whole storage below the MDDL.
Siltation: the curve does not stay put
Every river carries sediment, and a dam traps much of it. Sediment settles at every depth, not only in the dead storage set aside for it at the design stage [2][6], so the capacity at each level falls and a curve built from the original survey overstates the water held. The CWC's Handbook for Assessing and Managing Reservoir Sedimentation reports that more than 40 % of the surveyed Indian reservoirs had lost more than 20 % of their storage [6]. The remedy is a new survey and a revised curve: IS 7323 recommends capacity surveys every 3 to 5 years, or when the loss of capacity reaches 5 %, whichever is earlier [1], and the CWC O&M guidelines ask for a revised area-capacity curve after every new bathymetric survey [4]. Where the sediment settles, how fast Indian reservoirs are losing storage and how capacity is resurveyed are explained in why Indian reservoirs lose storage.
What the level record is used for
Rule-curve operation
A rule curve is "the target level planned to be achieved in a reservoir, under different conditions of probabilities of inflows and/or demands, during various time period in a year" [1]. It handles a basic conflict that IS 7323 describes in its foreword. Flood control is better served by keeping the level low early in the monsoon, but if the expected inflows then fail to arrive, the reservoir may not fill for the dry season [1]. The Barna Dam example in the CWC guidelines sets dated targets, such as being near FRL by 15 September, because later inflows cannot be relied upon [4]. Following a rule curve means comparing the actual level with the target level, every day and more often in a flood.
Flood moderation and gate operation
When a flood arrives, IS 7323 sets two aims for a full or nearly full reservoir: peak outflows should not exceed the inflows that would have occurred without the dam, and the rate of increase in outflow should not itself become a hazard downstream [1]. One way to achieve this is to begin opening the spillway gates before the level reaches FRL, when the expected inflow is likely to push it above FRL [1]. The Barna example limits the rate of rise above FRL to 10 cm per hour, so that the flood can be moderated over about 30 hours without crossing the MWL [4].
These rules are written in terms of level and its rate of change, and a limit of 10 cm per hour cannot be enforced from a reading every 12 hours. Gate discharge tables are also given "for different gate openings and reservoir levels" [4], so the outflow itself is computed from the level.
Inflow estimation
Few reservoirs have a gauging station on every stream that feeds them, so inflow is worked out from the change in storage (from the level) plus the measured outflow: the reservoir water balance, shown in the worked example below. IS 7323 expects forecasts of inflow and regulation plans to be prepared about every six hours during a storm [1].
Dam safety and downstream warning
The CWC Guidelines for Instrumentation of Large Dams ask that reservoir and tailwater levels be measured "to provide a continuous historical record", because seepage and uplift pressure depend directly on the difference between the two, and most other instrument readings are interpreted against them [3]. The O&M guidelines require downstream warning systems such as sirens and hooters, and a way of informing downstream areas before spillway releases [4]. A level record with a time stamp is what triggers and justifies those warnings. See how warnings reach people.
How often is often enough?
The standards set the minimum. IS 7323 asks for reservoir levels "at regular intervals, say every 24 hours or as required", and in floods "once in 3 hours or even more frequently", with reports at intervals of 6 hours or less [1]. The CWC O&M guidelines ask that the water level, inflow and spillway discharge be recorded hourly during the monsoon, and rainfall and reservoir levels daily outside it [4].
The illustrative flood below shows what happens with readings only at 08:00 and 20:00. The inflow rises from 100 to 1,200 m³/s in eight hours and then recedes. Two readings 12 hours apart give only the average inflow over those 12 hours.
The 12-hourly figure is a correct average that hides the peak, its timing and the rate of rise, which are what a gate operator needs. Hourly values in the same example peak at about 1,130 m³/s. Hourly manual readings are possible, but hard to sustain at night and in heavy rain for days on end. An automatic water level recorder logging every few minutes and sending data by telemetry keeps the record continuous. IS 7323 recommends sensors that record on site and work with a telemetry network for real-time operation [1].
The CWC guidelines list float, bubbler, ultrasonic and radar recorders, noting that non-contact radar gauges have become the most popular, with errors of about ±3 to 10 mm [3]. The CWC technical specifications ask for 3 mm resolution or better and mount radar sensors above the FRL [5]. Any sensor must share the datum of the area-capacity table, or every storage figure inherits the offset. For sensor choice, see radar, ultrasonic, float and pressure sensors compared.
Worked example: inflow from the rate of rise
All numbers here are illustrative and use the reservoir in the table above.
At 06:00 the level is 443.20 m. At 09:00 it is 443.50 m. The spillway gates are closed, and the powerhouse and canal together release 60 m³/s. What is the inflow?
Step 1  Mean level            h̄ = (443.20 + 443.50) / 2 = 443.35 m
Step 2  Surface area at h̄     A = 10.0 + (443.35 − 440) × (12.5 − 10.0) / 5
                                = 11.675 km² = 11.675 × 10⁶ m²
Step 3  Change in storage     ΔS = A × Δh = 11.675 × 10⁶ × 0.30
                                = 3.50 × 10⁶ m³
Step 4  Net rate              ΔS / Δt = 3.50 × 10⁶ / (3 × 3600 s)
                                = 324 m³/s
Step 5  Inflow                I = ΔS/Δt + O = 324 + 60 = 384 m³/s
The capacity table gives the same change (184.56 to 188.06 million m³). Evaporation and seepage are ignored over a few hours.
Three details change the answer more than people expect:
- Level error. If each reading can be 1 cm off, Δh can be wrong by up to 2 cm. Over 3 hours that is ±22 m³/s, about 6 % of the inflow. Over 1 hour the same 2 cm becomes ±65 m³/s. Short intervals need precise, steady readings, or the inflow series turns noisy.
- Wind and waves. A study of a large hydropower reservoir in Canada found that wind tilts and oscillates the water surface, that these swings carry into the water balance, and that on an hourly or daily basis they can make real-time inflow estimates unreliable [8]. Stilling, averaging over a few minutes and checking against a second gauge all help.
- An old curve. If siltation has reduced the area near 443 m by 5 % since the last survey, the old table overstates the net inflow by the same 5 %, about 16 m³/s here.
Try your own numbers in the calculator below.
The calculator uses the illustrative reservoir in this article. Its results are for learning only and do not apply to any real dam.
What else operators measure
Level is the centre of the record, but the standards also ask for:
- Rainfall in the catchment. IS 7323 calls for a network of ordinary and self-recording rain gauges, sited according to storm patterns and topography, and for stream gauging stations that also measure rainfall [1]. Rain gives warning hours before the inflow arrives. See tipping-bucket rain gauge errors.
- River stage and flow upstream. Gauging stations at key points upstream give an index of the total inflow and time to act [1]. The O&M guidelines ask for maps of the hydrological stations that collect river gauge, discharge, rainfall and sediment data [4].
- Releases. Spillway outflows hourly during the monsoon, and releases through outlets and sluices daily [4]. Without the outflow, the water balance cannot give the inflow.
- Tailwater and downstream levels. Tailwater is needed to interpret seepage and uplift [3]. For flood-control reservoirs IS 7323 also asks for gauging stations below the dam, at the places to be protected [1].
Measurement alone has limits. A modelling study of the August 2018 flood in Kerala's Periyar basin found that emptying the reservoirs in advance could have cut the peak by only 16 to 21 %, because much of the runoff came from intermediate catchments without dams. The authors called for reliable extreme-rainfall forecasts coupled with reservoir inflow forecasting and well-designed operating rules [9]; the case is examined in how dam spillways and gates work. Continuous level and rainfall data are where such forecasting starts.
Key points
- FRL, MWL, MDDL and DSL are defined in IS 7323 and IS 5477. The storage between them (surcharge, live, buffer, dead) is what the operator manages.
- Level becomes storage only through the elevation–area–capacity curve. Near the top of a reservoir a few centimetres hold millions of cubic metres.
- Siltation reduces capacity at every level, including the live storage. Curves need to be resurveyed, every 3 to 5 years or at 5 % capacity loss under IS 7323.
- Rule curves, gate tables and rate-of-rise limits are written in terms of level, so they need a level record at least hourly in the monsoon.
- Inflow is ΔS/Δt plus outflow, with ΔS ≈ A × Δh. Level errors, wind and an old curve all affect it, most over short intervals.
- Rainfall, upstream stage, releases and tailwater complete the picture.
ClimMaTech builds monitoring for dams and reservoirs: continuous reservoir and tailwater level, catchment rainfall and telemetry to a control room, so that the record the standards ask for is kept automatically. Tarang is our non-contact radar level sensor, an automatic water level recorder (AWLR), and our dam and reservoir monitoring solution brings level, rain and downstream data together for operators. For how readings travel to the control room, see what is an RTDAS.
References
- Bureau of Indian Standards, IS 7323:1994 Operation of Reservoirs – Guidelines (First Revision), BIS, 1994 (reaffirmed 1999). archive.org (archived copy).
- Bureau of Indian Standards, IS 5477 (Part 1):1999 Fixing the Capacities of Reservoirs – Methods, Part 1: General Requirements (First Revision), BIS, 1999. archive.org (archived copy).
- Central Water Commission, Central Dam Safety Organisation, Guidelines for Instrumentation of Large Dams, Doc. No. CDSO_GUD_DS_02_v1.0, Dam Rehabilitation and Improvement Project (DRIP), 2018. damsafety.cwc.gov.in (archived copy).
- Central Water Commission, Central Dam Safety Organisation, Guidelines for Preparing Operation and Maintenance Manual for Dams, Doc. No. CDSO_GUD_DS_03_v1.0, DRIP, 2018. damsafety.cwc.gov.in (archived copy).
- Central Water Commission, Central Dam Safety Organisation, Technical Specifications of Hydro-meteorological, Geodetic, Geotechnical and Seismic Instruments, Doc. No. CDSO_TS_DS_01_v1.0, DRIP, 2018. damsafety.cwc.gov.in (archived copy).
- Central Water Commission, Central Dam Safety Organisation, Handbook for Assessing and Managing Reservoir Sedimentation, Doc. No. CDSO_GUD_DS_04_v1.0, DRIP, 2019. damsafety.cwc.gov.in (archived copy).
- Central Water Commission, Water Management Directorate, Weekly Bulletin on Live Storage Status of 155 Reservoirs in the Country as on 20.03.2025, CWC, 2025. cwc.gov.in.
- M. Roy, L. Dolcine, M. Fuamba, Error Analysis of Wind Effects on Natural Flow Estimation, Journal of Hydrologic Engineering 22(4), 2017. doi:10.1061/(ASCE)HE.1943-5584.0001481HE.1943-5584.0001481).
- K. P. Sudheer, S. M. Bhallamudi, B. Narasimhan, J. Thomas, V. M. Bindhu, V. Vema and others, Role of Dams on the Floods of August 2018 in Periyar River Basin, Kerala, Current Science 116(5), 780–794, 2019. doi:10.18520/cs/v116/i5/780-794.