
Sizing solar power for an off-grid monitoring station
A step-by-step method for the panel and battery of a remote river or weather station, worked through with real sunshine data for Mandi, including the monsoon minimum, losses, days of autonomy and shading by hills.

Most remote hydromet stations in India run on a small solar panel and a battery. When one goes silent in August, the cause is often not the sensor or the network. The battery has run flat after a week of monsoon cloud, or a hillside shades the panel for half the winter day. Both problems can be designed out on paper before anything is bought. This article sets out the method we use, step by step. It works through a complete example for a station at Mandi in Himachal Pradesh, using real irradiance data for that location.
The method has six steps:
- Build a daily energy budget for the loads, in watt-hours (Wh).
- Find the design sunshine for the worst month at the site, from long-term data.
- Apply the system losses between the panel and the loads.
- Size the panel, including enough surplus to recharge the battery.
- Size the battery for the longest cloudy spell you want to ride through.
- Check tilt, direction and shading by the surrounding hills.
Step 1: the daily energy budget
List every load with its power when it is on and the time it is on per day. Energy is power multiplied by time, so a load drawing 2.5 W for one hour uses 2.5 Wh. If a datasheet gives current instead of power, multiply by the supply voltage: 0.2 A at 12 V is 2.4 W. The duty cycle is the fraction of time a load is on. A sensor that wakes for 30 seconds every 5 minutes has a duty cycle of 30/300 = 10 %.
The WMO Guide to Instruments and Methods of Observation recommends 12 V direct current for automatic stations. It notes that battery capacity depends on the mean power consumption of the whole system, including heating and the modem. It also warns that heaters and aspirators can consume considerable power [1]. Those two warnings are where most budgets go wrong.
The table below is an illustrative budget for a 12 V river station with a radar water-level sensor, a tipping-bucket rain gauge, integrated data logging and a cellular modem reporting every 15 minutes. The power figures are typical round numbers chosen for the example, not the specification of any product.
| Load | Power when on | Time on per day | Energy per day |
|---|---|---|---|
| Radar water-level sensor | 0.6 W | 30 s every 5 min: 288 × 30 s = 2.4 h | 1.44 Wh |
| Logger and controller | 0.25 W | 24 h | 6.00 Wh |
| Cellular modem, idle but registered | 0.4 W | 23 h | 9.20 Wh |
| Cellular modem, transmitting | 2.5 W | 96 reports × 37.5 s = 1 h | 2.50 Wh |
| Tipping-bucket rain gauge (passive contact) | about 0 | 0 | |
| Enclosure heater | 10 W | not needed at this site | 0 |
| Subtotal | 19.14 Wh | ||
| Margin for unknowns and ageing, 20 % | 3.83 Wh | ||
| Daily energy, E | about 23.0 Wh |
Two lessons are hidden in this table:
- The idle modem is the largest single load. It uses almost half of the subtotal (9.2 of 19.1 Wh) while doing nothing. Switching the modem off between reports, where the reporting interval allows it, can halve the whole budget. Our article on telemetry link design discusses the energy cost of each transmission.
- A heater changes everything. The same 10 W heater running 8 hours on a cold night would use 80 Wh, three and a half times the rest of the station. At high-altitude sites, decide early whether a heater is truly needed. If it is, budget for the coldest month, not the average.
Step 2: design sunshine from real data
The solar resource is described by daily irradiation: the solar energy that falls on one square metre in a day, in kWh/m². Panels are rated in watt-peak (Wp), the power they deliver under a standard irradiance of 1 kW/m². So 4 kWh/m² in a day is equivalent to four hours at that standard irradiance. This is why daily irradiation in kWh/m² is also called peak sun hours (PSH). A 20 Wp panel in 4 PSH can deliver at most 20 × 4 = 80 Wh before losses.
Rules of thumb and annual averages are not good enough for an off-grid station. You need monthly values, and the worst ones. The European Commission's Joint Research Centre provides free long-term estimates through PVGIS (Photovoltaic Geographical Information System) [2]. For India, PVGIS 5.3 uses the ERA5 reanalysis for 2005 to 2023 [3]. ERA5 is a global reconstruction of past weather with hourly output on a grid of about 31 km [4]. We retrieved monthly values for Mandi (31.708° N, 76.932° E, 774 m) for a horizontal surface and for a panel facing due south at 25° tilt. We converted each monthly total to a daily mean.
The chart shows the central fact about solar power in the western Himalayan foothills. On a flat surface, December and January are the poorest months (3.34 PSH). Tilt the panel towards the south and winter recovers strongly (5.07 PSH in December), because the low winter sun now strikes the panel more squarely. The monsoon then becomes the limiting season. August averages 4.06 PSH, and the worst August in the record gave only 3.41.
For the design we take the worst single month on record for the chosen orientation: 3.41 PSH. That covers a poor monsoon, not just an average one. Remember that a grid cell about 31 km across averages the clouds of ridges and valleys together. A local station can see longer dull spells than the data show, and the battery step below allows for this.
Step 3: system losses
Not every watt-hour that reaches the panel reaches the loads. Multiply the losses together into a single performance ratio (PR). PVGIS gives the first two for this site. The others are illustrative values for a small, well-installed system.
| Loss | Factor | Source |
|---|---|---|
| Panel temperature and low light | 0.91 | PVGIS, Mandi, annual (−8.85 %) [2] |
| Reflection at the glass at oblique sun angles | 0.98 | PVGIS, Mandi, annual (−2.31 %) [2] |
| Dust and dirt on the panel | 0.97 | illustrative |
| Cables and connections | 0.97 | illustrative |
| Charge controller (MPPT type) | 0.95 | illustrative |
| Battery charge and discharge | 0.90 | illustrative |
| Product, PR | 0.71 | 0.91 × 0.98 × 0.97 × 0.97 × 0.95 × 0.90 |
As a cross-check, the PVGIS off-grid calculator applies an overall performance ratio of 0.67 [5], close to our figure.
PWM or MPPT? The charge controller sits between panel and battery, regulates charging and protects the battery. IEC 62509 sets minimum performance and functioning requirements for charge controllers used with lead-acid batteries in PV systems [6]. There are two common types:
- A PWM (pulse-width modulation) controller connects the panel directly to the battery and switches it on and off. The panel is therefore forced to work at battery voltage, around 13.5 V while charging in our illustration. A panel built for 12 V systems has its maximum power point at a higher voltage; we take 17.5 V for the example. Panel current changes little with voltage below that point, so the power delivered falls roughly in proportion to the voltage: 13.5 / 17.5 = 0.77 of the rated power.
- An MPPT (maximum power point tracking) controller converts the panel's voltage down to battery voltage and keeps the panel at its best operating point, so only the converter loss remains.
With PWM in our example, the voltage ratio of 0.77 largely replaces the temperature and controller factors, because panel current hardly changes with temperature. That gives PR ≈ 0.77 × 0.98 × 0.97 × 0.97 × 0.90 = 0.64. The difference is about 10 % here. It grows in cold, clear weather, when the panel's best voltage rises and a PWM controller cannot use it.
Step 4: panel size
Minimum panel (Wp) = E / (design PSH × PR)
                   = 23.0 / (3.41 × 0.71) = 23.0 / 2.42 = 9.5 Wp   (MPPT)
                   = 23.0 / (3.41 × 0.64) = 23.0 / 2.18 = 10.5 Wp  (PWM)
This minimum only balances one average day of the worst month. It has nothing left over to recharge the battery after a cloudy spell. Check the recharge time instead. In an average August (4.06 PSH), each watt-peak delivers 4.06 × 0.71 = 2.88 Wh a day:
- A 10 Wp panel makes 28.8 Wh, leaving 5.8 Wh a day above the load. Refilling a five-day deficit of 115 Wh would take about 20 days.
- A 20 Wp panel makes 57.7 Wh, leaving 34.7 Wh a day. The same deficit is refilled in about 3.3 days.
So the example station gets a 20 Wp panel. The cost of a larger panel is small compared with a site visit in the monsoon.
Step 5: battery and days of autonomy
Days of autonomy is the number of days the battery alone must carry the load with no useful sun. Depth of discharge (DoD) is the fraction of the rated capacity that is actually used. The PVGIS off-grid tool uses a default discharge cut-off of 40 % (60 % usable) suited to lead-acid, and suggests about 20 % for lithium batteries [5]. The WMO Guide also describes it as good practice to shut a station down when the battery voltage falls below a fixed threshold, to protect batteries that do not tolerate deep discharge [1].
What does the record say about cloudy spells? We took the PVGIS hourly series for a 25° panel at Mandi, summed it day by day for 2005 to 2023, and ran the example station through it. The worst spell was 22 to 24 September 2018: three consecutive days below 1 PSH. With a 20 Wp panel, the largest deficit the battery ever had to cover was 36 Wh, about 1.6 days of load.
We still design for 5 days, for three reasons. The data are smoothed over a large grid cell. Clouds, fog in the valley and a dirty panel can coincide. And a site visit may be impossible for days after a flood or a landslide. Published work shows that designs based on average radiation or on the average number of consecutive cloudy days can give inadequate continuity of supply [7]. That is why we test the design against the full daily record rather than a single average.
Usable energy needed = E × days of autonomy = 23.0 × 5 = 115 Wh

Lithium iron phosphate, 80 % usable:  115 / 0.80 = 144 Wh  →  144 / 12.8 V = 11.2 Ah  →  choose 12 Ah
Lead-acid, 60 % usable:               115 / 0.60 = 192 Wh  →  192 / 12 V   = 16.0 Ah  →  choose 18 Ah
Battery capacity falls in the cold, and some chemistries must not be charged below freezing. At Mandi's elevation the mean January air temperature in the PVGIS data is about 6 °C. A station a few thousand metres higher needs a further allowance, explained in batteries in the cold. IEC 61427-1 sets out general requirements and test methods for batteries used in off-grid PV applications [8]. It is a useful reference when comparing battery datasheets.
Independent check. The PVGIS off-grid calculator simulates the battery through the whole 2005 to 2023 record [5]. We gave it the example's 23 Wh a day, a 25° south-facing panel and a 20 % cut-off:
| Panel | Battery (nominal) | Days battery empty | Days battery reaches full | August: days empty |
|---|---|---|---|---|
| 20 Wp | 144 Wh | 0 % | 97.5 % | 0 % |
| 10 Wp | 144 Wh | 0 % | 82.2 % | 0 % |
| 10 Wp | 60 Wh | 2.3 % | 83.2 % | 15.3 % |
| 20 Wp | 60 Wh | 0.07 % | 97.5 % | 0 % |
The 10 Wp panel never ran the larger battery flat in the model. But the battery reached full charge on only about a third of August days (34.8 %). The battery spends the wettest weeks of the year partly charged, with no reserve for a worse year than the record. Halving the battery as well left a 10 Wp station flat on about one August day in seven.
Step 6: tilt, direction and the hills
In the northern hemisphere the panel faces due south. A compass points to magnetic north, so correct the reading for the local magnetic declination. The best tilt depends on what you are optimising. PVGIS gives 34° as the tilt that collects the most energy over a year at Mandi [2]. An off-grid station, however, is limited by its worst month, so we compared tilts on that basis:
| Tilt | Worst month (mean) | Worst single month 2005–2023 | Annual mean |
|---|---|---|---|
| 0° (flat) | 3.34 (Dec) | 2.86 (Jan) | 4.79 |
| 10° | 4.02 (Jan) | 3.39 (Jan) | 5.16 |
| 20° | 4.09 (Aug) | 3.44 (Aug) | 5.41 |
| 25° | 4.06 (Aug) | 3.41 (Aug) | 5.48 |
| 34° | 3.94 (Aug) | 3.29 (Jul) | 5.54 |
| 50° | 3.44 (Jul) | 2.89 (Jul) | 5.36 |
| 60° | 3.04 (Jul) | 2.58 (Jul) | 5.08 |
All values are daily irradiation in kWh/m² (PSH) on a south-facing panel, from PVGIS 5.3 (ERA5) [2].
The familiar advice to tilt steeply for winter would hurt here, because steep panels see less of the high monsoon sun. Anything from about 20° to 30° gives nearly the same worst month. We use 25° in the example.
Shading by hills can outweigh every other choice. PVGIS computes a horizon from a 90 m elevation model [3]. At Mandi it rises to 15 to 19° towards the south. Even this cuts about 2 hours from the 21 December day, and reduces December irradiation on the 25° panel from 5.50 to 5.07 PSH.
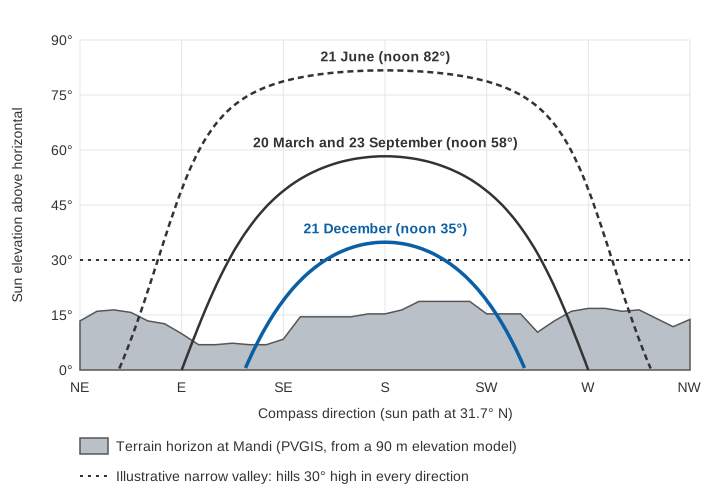
An elevation model this coarse cannot see the near valley side, a bridge girder, trees or a building. River stations often sit at the bottom of exactly such valleys. To show the effect, we re-ran PVGIS with an illustrative horizon of 30° all round. December on the 25° panel fell from 5.07 to 3.25 PSH. The worst single month became January at 2.87 PSH, lower than the monsoon. In a deep valley the binding season can move back to winter, and the panel must grow accordingly.
Measure the real horizon on site with a compass and clinometer, at the planned panel position, every 10° or so from east to west. Enter it into PVGIS, which accepts a user horizon [5]. Mount the panel as high on the structure as is safe, and clear the vegetation that shades it. The post-monsoon maintenance checklist includes cleaning the panel and checking for new shade.
Try it yourself
The calculator below repeats the method. Change the loads, the design sunshine, the losses or the autonomy and watch the panel and battery change.
Commissioning and in service
A paper design is only as good as its inputs. Three habits keep it honest:
- Measure the loads. Put a meter in the supply and log the real current for a few days in every mode, including retries when the network is poor.
- Send power health with the data. Battery voltage and charging current with every report show a shrinking margin weeks before the station fails. The WMO Guide recommends monitoring the power supply, including battery voltage and the charging current from the panels [1].
- Re-check after changes. A faster reporting interval, a new sensor or a new building on the bank changes the budget. Re-run the six steps.
Key points
- Size for the worst month at your site, from long-term data, not for the annual average.
- At Mandi a south-facing panel at 20 to 30° makes the monsoon the limiting season (3.41 PSH in the worst August on record). A flat panel would make winter the limit.
- Multiply all losses into one performance ratio, about 0.7 for a small MPPT system. A PWM controller costs roughly another 10 %.
- The idle modem and any heater usually dominate the budget. Duty-cycle the first and question the second.
- Size the panel to refill the battery after a spell, not just to balance an average day.
- Choose days of autonomy with margin over the record, then check the design against the full daily series.
- Measure the horizon at the panel. A narrow valley can cut winter sunshine by a third and move the critical month.
Where ClimMaTech fits
We work through this kind of budget, against data for the actual site and its horizon, whenever we plan a station. Our approach to complete remote stations is described under RTDAS and hydromet telemetry. The instruments these stations power include Tarang, an AWLR (automatic water level recorder), and PRAVAAH, an AWLR and surface velocity radar (SVR) that also gives non-contact discharge at a surveyed cross-section.
References
- World Meteorological Organization, Guide to Instruments and Methods of Observation, Volume III: Observing Systems, Chapter 1 "Measurements at automatic weather stations", section on power supply, WMO-No. 8, 2024 edition. WMO publication page.
- European Commission Joint Research Centre, Photovoltaic Geographical Information System (PVGIS) 5.3, monthly radiation, hourly series, grid-connected and off-grid calculations and horizon for 31.708° N, 76.932° E, PVGIS-ERA5 2005–2023. re.jrc.ec.europa.eu.
- European Commission Joint Research Centre, PVGIS 5.3 release notes (radiation databases, ERA5 2005–2023, horizon computed from SRTM 90 m elevation data), 2024. joint-research-centre.ec.europa.eu.
- H. Hersbach and others, The ERA5 global reanalysis, Quarterly Journal of the Royal Meteorological Society 146 (2020), 1999–2049. doi:10.1002/qj.3803.
- European Commission Joint Research Centre, PVGIS user manual (off-grid calculation, battery discharge cut-off, performance ratio, user-defined horizon). joint-research-centre.ec.europa.eu.
- International Electrotechnical Commission, IEC 62509:2010 Battery charge controllers for photovoltaic systems: Performance and functioning, 2010. webstore.iec.ch.
- E. Quiles, C. Roldán-Blay, G. Escrivá-Escrivá, C. Roldán-Porta, Accurate sizing of residential stand-alone photovoltaic systems considering system reliability, Sustainability 12(3), 1274 (2020). doi:10.3390/su12031274.
- International Electrotechnical Commission, IEC 61427-1:2013 Secondary cells and batteries for renewable energy storage: General requirements and methods of test, Part 1: Photovoltaic off-grid application, 2013. webstore.iec.ch.