
Bridge scour monitoring: why river level is not enough
Scour hides under the water and often refills before anyone looks, so a river level reading tells you when a bridge is at risk but not what the bed is doing.

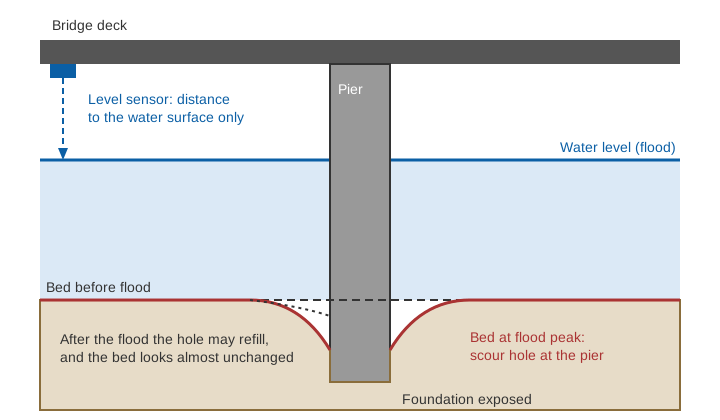
After a big flood, an engineer walks onto a bridge and looks down. The water has dropped, the riverbed looks level, and nothing seems wrong. Yet a day earlier, at the flood peak, the bed around one pier may have been several metres deeper, and the foundation may have been left standing with little soil around it. Bridge scour monitoring exists because this damage happens out of sight and can be undone by the river itself before anyone measures it. This article explains what scour is, how the scour level in a bridge is estimated and measured, and why a water level record, however accurate, cannot replace a look at the bed.
What is scour on a bridge?
Scour on a bridge is the erosion of bed and bank material by flowing water, around the piers and abutments (the supports at the ends of the bridge) that hold the structure up. The US Federal Highway Administration (FHWA) defines it as the erosive action of flowing water that excavates and carries away material from the bed and banks of streams and from around piers and abutments [1]. Its manual on the subject, Hydraulic Engineering Circular No. 18 (HEC-18), states that the most common cause of bridge failure is floods scouring bed material from around bridge foundations [1].
Total scour at a bridge has three parts that are added together in design [1]:
- Long-term degradation: a gradual lowering of the riverbed over a long reach, for example because upstream dams trap sediment or sand is mined from the channel.
- Contraction scour: lowering of the bed across the waterway because the bridge and its approaches squeeze the flow into a narrower opening, which speeds it up.
- Local scour: a hole dug around a pier or abutment, where the obstruction accelerates the flow and creates vortices that lift the bed material.
Two further terms matter. In clear-water scour, the river upstream is not moving bed material, so the hole is dug without being fed. In live-bed scour, sediment is arriving from upstream all the time [1].
Why scour holes disappear
HEC-18 makes a point that shapes every monitoring plan: scour can be deepest near the peak of a flood but hardly visible as the water recedes and holes refill with sediment [1]. In live-bed conditions the hole that opens on the rising limb of a flood is cyclic and refills on the falling limb [1]. The same manual warns that during a flood scour is generally not visible, and that visual monitoring during a flood and inspection after it cannot fully determine that a bridge is safe [1].
Under constant flow, scour reaches its maximum depth in sand and gravel in hours and in cohesive soils in days, but real bridges may need several floods to reach it [1]. The Schoharie Creek bridge in New York, which collapsed in April 1987 and killed ten people, had survived a larger flood in 1955. HEC-18 records that many floods between 1953 and 1987 progressively removed the riprap (the stone armour placed around piers), so the spread footings were undermined in the 1987 flood; the US National Transportation Safety Board gave failure to maintain adequate riprap as the probable cause [1].
What is the scour level in a bridge, and how is it estimated?
The scour level in a bridge is the depth below the flood level, or below the original bed, to which the bed is expected to be lowered at a pier or abutment. It is first estimated during design, and the foundation is then taken deeper than that level.
Indian road bridges follow IRC:78, the Indian Roads Congress code for foundations and substructure. In its 2014 edition, the method for natural channels over a scourable bed is based on a Lacey-type relation [3]:
d_sm = 1.34 × ( D_b² / K_sf )^(1/3)

d_sm = mean depth of scour below highest flood level (HFL), m
D_b  = design discharge per metre width of effective waterway, m³/s per m
K_sf = silt factor = 1.76 × √d_m,  with d_m the weighted mean bed grain size in mm
The design discharge used for foundations is larger than the discharge used for waterway design: 30 % larger for catchments up to 3,000 km², falling to 10 % above 40,000 km² [3]. Maximum scour for a pier with an individual foundation and no floor protection is then taken as 2.0 × d_sm, and for an abutment as 1.27 × d_sm or 2.0 × d_sm depending on how the approach is retained [3].
Illustrative example. Take D_b = 10 m³/s per metre and a sand with weighted mean grain size d_m = 1.0 mm:
K_sf = 1.76 × √1.0 = 1.76
d_sm = 1.34 × (10² / 1.76)^(1/3) = 1.34 × (56.8)^(1/3) = 1.34 × 3.84 = 5.1 m
Pier: 2.0 × 5.1 = 10.3 m below HFL
The code itself is cautious about such calculations. It says scour depth should be determined from actual observations wherever possible, especially in clayey and bouldery strata, with soundings taken in the vicinity of the site during or immediately after a flood, before the holes silt up [3]. For flashy rivers with beds that scour poorly, it says the maximum depth should come from observations [3].
Where does water depth come in?
The FHWA pier scour equation, used widely for local scour at a pier, shows why level alone is a weak guide [1]:
ys / a = 2.0 × K1 × K2 × K3 × (y1 / a)^0.35 × Fr1^0.43

ys = scour depth, a = pier width, y1 = flow depth upstream of the pier
Fr1 = V1 / √(g × y1)   (Froude number, a measure of flow speed against depth)
K1, K2, K3 = factors for pier nose shape, angle of attack and bed condition
Illustrative example. A round-nosed pier 1.5 m wide faces the flow squarely (K1 = 1.0, K2 = 1.0) on a bed with K3 = 1.1 [1]. The approach velocity is 3 m/s.
y1 = 4 m:  Fr1 = 3 / √(9.81 × 4) = 0.48;  ys/a = 2.2 × 1.41 × 0.73 = 2.26;  ys = 3.4 m
y1 = 6 m:  Fr1 = 3 / √(9.81 × 6) = 0.39;  ys/a = 2.2 × 1.62 × 0.67 = 2.39;  ys = 3.6 m
Raising the water by 2 m at the same velocity increases the scour by only about 6 %. What drives scour is velocity, pier geometry, the angle of the flow, the bed material and how long the flood lasts. Depth enters only weakly. Water level is still a useful indicator of how big the flood is, but it is not a measurement of the bed.
How does bridge scour monitoring work?
Bridge scour monitoring works by measuring the bed itself, or something that moves when the bed moves. HEC-18 sorts the instruments into portable and fixed devices [1].
- Portable devices are operated by an inspector: sounding rods or weights, and sonar (echo sounders). They give a reading at one place and time, they suit occasional checks at many bridges, and they cannot document the history of scour at a location. In flood they are hard to use, because the conditions that matter are the hazardous ones [1].
- Fixed devices stay on the bridge: sounding rods fixed to piers, sonars, buried or driven rods with a sliding magnetic collar, float-out sensors buried in the bed, tilt sensors and time domain reflectometers. They can report during a flood without an inspector present, often through a data logger or a telemetered signal. Many record the maximum scour depth reached during the flood even if the hole later refills, and some sonars also track the refill. Their limits are higher cost, measurement at a single point, and damage from ice or debris [1].
- Dynamic-response methods infer scour from how the structure itself behaves, for example a change in its natural frequency as its foundation loses support. A critical review by Prendergast and Gavin notes that most monitoring regimes rely on expensive underwater instruments that are often damaged during floods, which is when scour risk is greatest, and examines methods based on the structure's dynamic response as an alternative [2].
HEC-18 treats monitoring devices as a kind of countermeasure. They do not fix the scour, but they reduce the risk by giving early warning and allowing timely closure of a bridge [1].
What does bridge scour inspection involve?
Bridge scour inspection is a routine check of the bridge and the channel around it, combined with a plan for floods. In the United States, a bridge found to be scour critical must have a Plan of Action: instructions on the type and frequency of inspection, a schedule for countermeasures, a monitoring programme, and the flood conditions at which the bridge is closed [1]. The federal guidance behind it calls for inspectors to be trained in collecting and comparing cross-section data and in recognising conditions that point to scour [1]. Comparing surveyed sections between visits is how a lowered bed shows up even when the water hides it. We describe cross-section surveys in river cross-section surveys: why they matter and how often to repeat them.
What river level can and cannot do
A water level record at a bridge is valuable, but for a different question. It tells you how high the river is, how fast it is rising, and how close it is to the levels that a Plan of Action names as triggers for inspection or closure. It does not tell you the bed elevation, the depth of a scour hole, or whether riprap has moved.
That distinction matters in Himachal Pradesh and across the Himalayan region, where flash floods carry large rises in short periods. In July 2023, the state's Public Works Department reported 15 bridges washed away and 34 substantially damaged after about 15 days of heavy rain and flash floods [4]. In our hydrometeorological analysis of those floods, we found that the peak was inflated and sustained by very heavy rain falling on near-saturated soil and, in places, snowmelt [5]. A level record alone cannot show how much bed was lost at any foundation.
A practical arrangement is therefore to combine the two. Use the river level to know when the flood is large enough to call for action, and use bed measurement (fixed devices at critical piers, soundings during and just after floods, surveyed cross-sections) to learn what the flood did. Radar level sensors that look down from the deck are described in radar water level sensing explained, and installation is covered in how to install radar level and velocity sensors on a bridge.
Key points
- Scour is erosion of the bed around piers and abutments. Total scour is long-term degradation plus contraction scour plus local scour.
- Scour holes can be deepest at the flood peak and refill as the water falls, so inspection after a flood can miss them.
- IRC:78-2014 estimates mean scour with a Lacey-type equation, takes the pier maximum as twice the mean, and asks for observations and soundings during or just after floods wherever possible.
- Bed-measuring instruments are portable (rods, sonar) or fixed (sounding rods, sonar, buried devices), and fixed ones can record the maximum depth reached even after refilling.
- River level shows the size of a flood and when to act. It does not measure the bed.
Where ClimMaTech fits
At ClimMaTech we work on the water level side of this problem. Tarang is an AWLR (Automatic Water Level Recorder) that measures river level with radar from above the water, which suits a bridge deck, and it records the level on board. It measures water level only: it does not measure scour or bed level, and it is meant to complement, not replace, bed surveys and instruments. Our river monitoring page describes how level records at bridges and along rivers support flood warning.
References
- L. A. Arneson, L. W. Zevenbergen, P. F. Lagasse, P. E. Clopper, Evaluating Scour at Bridges, Hydraulic Engineering Circular No. 18, 5th edition, Publication FHWA-HIF-12-003, Federal Highway Administration, U.S. Department of Transportation, April 2012. rosap.ntl.bts.gov
- L. J. Prendergast, K. Gavin, A review of bridge scour monitoring techniques, Journal of Rock Mechanics and Geotechnical Engineering 6(2), 138–149, 2014. doi:10.1016/j.jrmge.2014.01.007
- Indian Roads Congress, IRC:78-2014, Standard Specifications and Code of Practice for Road Bridges, Section VII: Foundations and Substructure (revised edition), clause 703; the Indian Roads Congress has since issued a third revision of Part 1 (2024). law.resource.org (archived copy)
- 15 bridges washed away, 34 damaged in Himachal Pradesh floods, The Tribune, 26 July 2023. tribuneindia.com
- V. Gupta, B. Syed, A. Pathania, S. Raaj, A. Nanda, S. Awasthi, D. P. Shukla, Hydrometeorological analysis of July-2023 floods in Himachal Pradesh, India, Natural Hazards 120(8), 7549–7574, 2024. doi:10.1007/s11069-024-06520-5