
How to install radar level and velocity sensors on a bridge
Where on the bridge to put them, how high and how far out to mount them, how to aim a velocity radar, and how to set and check the zero.

A radar on a bridge looks like the simplest river station there is: a box on a bracket, looking down at the water. Yet a beam that grazes a pier at low water, a bracket that sags, a zero set against the wrong reference or a velocity radar aimed into a pier's wake will each produce a record that looks plausible and is wrong. This guide covers radar level sensor installation on a bridge, plus the extra steps for a surface velocity radar, from choosing the spot to commissioning.
How the sensors work is covered in how FMCW radar measures river water level and surface velocity radar for rivers, and choosing one in how to choose a river water level sensor. Here the sensor is chosen; the question is where and how to fix it.
Where on the bridge should the sensors go?
Put them over a straight, stable reach, mid-span between piers, where the water under the beam is open at every level, and where a person can reach the bracket safely.
The reach. The WMO Manual on Stream Gauging describes the ideal gauge site: the stream is straight for about ten times its width upstream and downstream (where a channel reach controls the level), the bed is free of scour and fill, and the site is far enough from a confluence or a reservoir to avoid variable backwater (a level raised by water held up downstream) [1]. Bridges are chosen for convenience, so check. The manual also warns that bridges tend to intensify scour and fill [1], which matters when the cross-section is surveyed (see river cross-section surveys).
Which side of the bridge. For water level, WMO recommends that a gauge at or near a bridge be placed on the downstream side, or, if that is not possible, far enough upstream to be out of the drawdown (the local dip in the water surface) that the bridge causes at medium and high water [1]. For velocity, the gauging manuals see advantages on both sides: upstream, the flow is usually smoother, approaching drift can be seen and the bed scours less; downstream, the flow lines may be straightened by the bridge opening and debris is less likely to pile up against the piers [1][2]. Decide for each bridge.
Which span. Choose a span over the main flow, at mid-span, away from the piers. In one field study, radar surface velocities agreed with an acoustic Doppler current profiler (ADCP) to within 5 % across most of a section, but differed by up to 15 % near the banks and in the wake of a bridge pier [3]. A USGS study computed discharge from a single surface velocity measured at the vertical of maximum velocity [4]. For a level radar, the water under the beam must stay open at the lowest flow: not over a bar that dries out or a pool where floating debris collects.
Obstructions and access. Walk the deck and look down: pipes, cables, drainage spouts, vegetation, pier caps and bracing can all sit in or near a beam. For work on road bridges, CWC's field manual asks for warning signs on both approaches, a working area marked with cones, and particular care on narrow bridges without footpaths [2]. A bracket reachable from the footpath, without leaning over the railing, gets serviced more often and more safely.
How to mount a radar level sensor
Mount it plumb, on a rigid bracket, high enough to stay out of the largest flood and out of its own dead band, and far enough out from the bridge that the beam sees only open water at the lowest level.
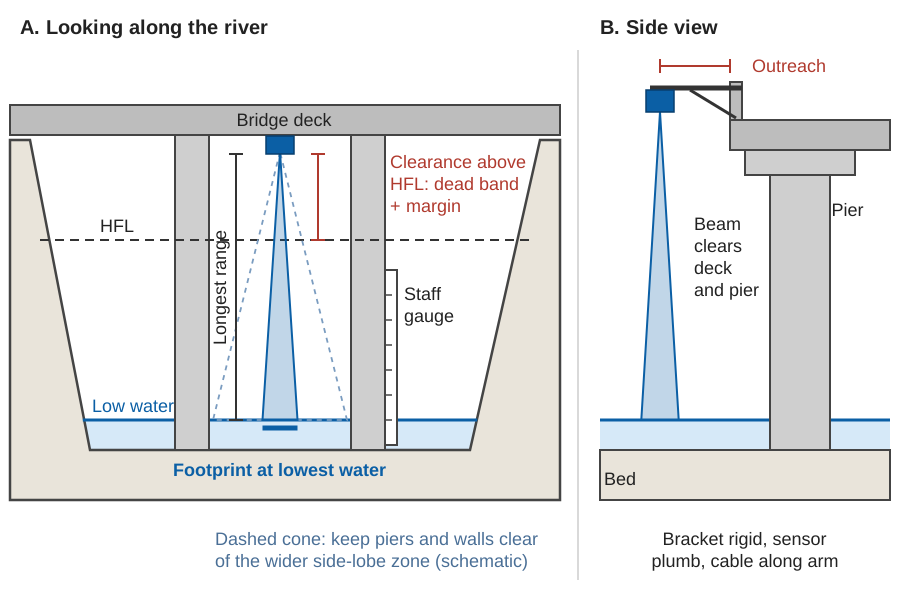
Height: above the highest flood, with a margin
WMO lists "instruments, shelter, and housing above all flood levels" among the criteria for a gauge site, and asks for high-water marks and residents' accounts of historic floods before the height is fixed [1]. In India the reference is usually the highest flood level (HFL), which CWC defines as "the highest flood level of the river ever recorded at the place". Where a site is at or near a bridge, CWC's procedure compares the HFL used to design the bridge with its own highest observed level and adopts the higher of the two [5]. Use the same rule for a sensor.
Above the HFL, add two allowances:
- The dead band, also called the blanking distance: the zone just in front of the antenna where the sensor cannot measure. Its size is on the datasheet.
- A margin for waves, the rise of water piled up against the bridge in a flood, floating debris, and floods larger than any yet recorded.
Mounting higher is not free: the range to the lowest water grows, and so does the footprint. Check that the sensor's range covers the lowest water you expect, not just today's.
Footprint and clearance from piers and walls
The patch of water a radar measures grows with distance:
footprint diameter = 2 · d · tan(θ / 2)
d = distance from antenna to water,  θ = beam angle
The footprint is largest at the lowest water, so check clearances there. Nothing solid may sit inside the beam at any level, and the wider cone around it, where weaker side lobes spill energy, should also be clear. On a bridge this sets the outreach: the bracket must hold the sensor far enough from the parapet that the beam clears the deck edge, the pier cap and any wall below. The FMCW radar explainer tabulates footprints for common beam angles, and how to choose a river water level sensor gives a rule of thumb for outreach from a vertical face.
Worked example (illustrative). On the station gauge, the HFL is 7.8 m, the lowest water 0.5 m, and the antenna is fixed at 10.0 m.
| Check | Arithmetic | Result |
|---|---|---|
| Clearance above HFL | 10.0 − 7.8 | 2.2 m, to cover dead band plus margin |
| Longest range (to lowest water) | 10.0 − 0.5 | 9.5 m |
| Footprint, 8° beam, at lowest water | 2 × 9.5 × tan 4° | 1.33 m across |
| Beam radius at lowest water | 9.5 × tan 4° | 0.66 m |
A pier face 0.8 m from the beam centre would clear the main beam but sit in the side lobes; we would move the sensor towards mid-span.
Plumb, rigid and looking at clean water
A tilted sensor measures along a slanted path, longer than the vertical distance, so set it plumb with a spirit level or digital inclinometer and lock the adjustment.
The bracket must be stiff. A road bridge vibrates with traffic, and a bracket moves with wind and with daily heating and cooling; any movement of the sensor moves the zero of the record. Use a short, braced arm, and level the sensor's reference point from a benchmark at installation and at each inspection (see gauge zero, datum and benchmarks).
Finally, look at the water under the beam: foam, standing waves behind a pier, or an eddy that traps weed and plastic all make the echo less stable.
How to install a surface velocity radar
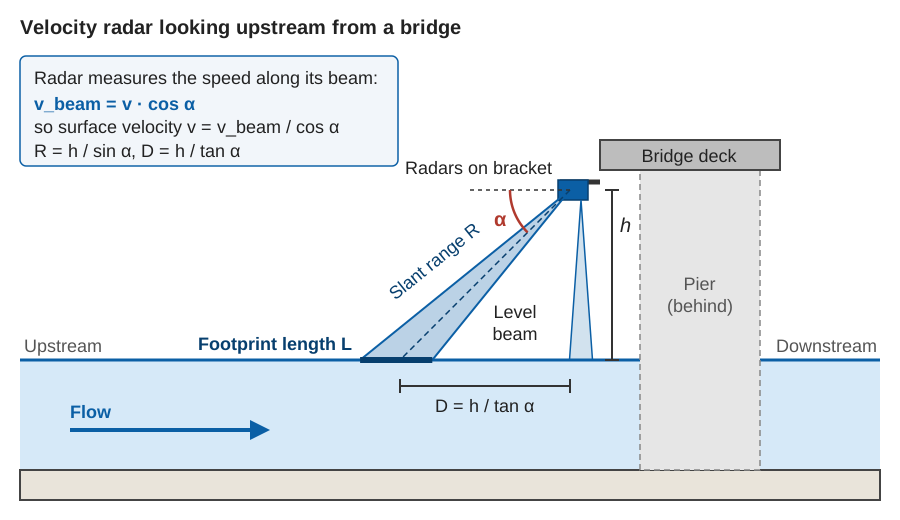
Point it along the flow, upstream or downstream, tilted down at a measured angle, at rippled water that represents the main flow and is clear of the pier wake. Record the angle: every reading depends on it.
The tilt angle and the cosine correction
A Doppler radar measures the velocity component along its beam. If the beam is tilted down at α from the horizontal and lies along the flow in plan, the surface velocity is:
v = v_beam / cos α
v_beam = velocity measured along the beam
If the beam is also turned by a horizontal angle φ from the flow:  v = v_beam / (cos α · cos φ)
A shallow tilt puts the target far away, with a large footprint and weak return; a steep tilt gives a strong return, but a small component along the beam and larger angle errors [3][6]. A field assessment of handheld surface velocity radars advised a tilt above 30° and up to 60° when the signal is weak, noted underestimation reported above 45–55°, and found that inaccurate tilt sensors caused systematic errors of up to 10 % [3]. In tests on the Tiber in Italy, a Doppler sensor was set at 30° or 45° with an inclinometer accurate to ±1°, allowing for the slope of the river surface [6].
Measure the angle; never estimate it by eye. With α = 45°, an angle that is really 47° makes every reading 3.6 % low (cos 47° ÷ cos 45° = 0.965); the SVR explainer tabulates other cases. The same field study preferred bridges at right angles to the flow, which need no horizontal correction [3]. On a skewed bridge, turn the radar to face along the flow and measure any remaining angle.
Upstream or downstream?
A Doppler radar can be pointed either way [6]; only the sign of the frequency shift changes. What changes is the water it sees. Looking upstream from the upstream face, the beam meets water before it reaches the piers; the USGS used this arrangement with a handheld radar on a bridge deck, aimed about 30 m upstream [4]. Looking downstream, the beam may land in the pier wake [3]. But a bracket on the upstream face meets floating debris head-on, and the level radar may be better downstream. For a combined unit, check the level footprint against drawdown and obstructions, and the velocity footprint against the pier wake.
Footprint and mounting height
The velocity footprint is a stretched ellipse whose length depends on the height h, the tilt α and the beam width in the vertical plane. Illustrative values for a beam 12° wide in that plane and 12° across:
| Height h | Tilt α | Slant range R | Horizontal distance D | Footprint length | Footprint width |
|---|---|---|---|---|---|
| 8 m | 30° | 16.0 m | 13.9 m | 7.0 m | 3.4 m |
| 8 m | 45° | 11.3 m | 8.0 m | 3.4 m | 2.4 m |
| 8 m | 60° | 9.2 m | 4.6 m | 2.3 m | 1.9 m |
| 10 m | 45° | 14.1 m | 10.0 m | 4.3 m | 3.0 m |
When the river falls, h grows and the radar looks further away at a larger patch. Large footprints average out local disturbance, but from a 10 m high bridge the illuminated area in one study covered the whole channel width, mixing fast and slow water and giving poor discharge estimates [3]. Keep the footprint inside the part of the section you want to represent, at all levels.
Ripples, rain and wind
A Doppler radar sees ripples, not water. WMO states that "some water surface roughness must be present", generated by turbulent boils, wind or rain [1]; at low wind and low flow there may be too little for a usable signal [4]. Two weather effects matter:
- Wind drags the surface. The USGS work cites a drift of about 2 % of the wind speed at 10 m height: for a 10 m/s wind, 20 cm/s at the surface and about 11 cm/s at the depth the radar senses, an error only when the wind blows along the beam [4]. In a valley where the wind blows up or down the river, it often does.
- Rain roughens the surface but also disturbs it; erratic readings have been observed in light rain [3].
Avoid aiming over a sheltered, glassy pool, and flag readings taken in rain or strong wind.
Try it: beam footprints for your bridge
Surface velocity is not discharge: you also need the flow area, from level and a surveyed cross-section, and a site-calibrated coefficient from surface to mean velocity; see can radar measure river discharge?.
Setting the zero against the staff gauge
A radar measures distance down to the water. To report level on the station's gauge datum, the logger subtracts that distance from a fixed offset, the level of the sensor's reference point on that datum:
level = offset − distance
offset = staff gauge reading + radar distance   (both taken at the same moment)
At installation, read the staff gauge and the radar together several times over a few minutes, and average each. For example (illustrative), a staff reading of 1.235 m and an averaged radar distance of 8.765 m give an offset of 10.000 m. Record readings, time and observer in the station record.
The staff gauge itself must be tied to benchmarks; the levelling is explained in gauge zero, datum and benchmarks. If no staff gauge is visible from the bridge, fix one on a pier face or the bank before commissioning. Warning and danger levels mean nothing in a record on a different zero (warning level vs danger level).
How do you calibrate a radar level sensor?
You check it against the staff gauge and correct the zero offset; the distance measurement itself is calibrated by the maker. At each visit, read the staff gauge and the radar at the same moment and compare. CWC's routine for digital water level recorders is the same: read the reference staff gauge, check the current level and the logger clock, and enter all of them in the station record book [2].
Then look at the differences over several visits:
- A steady difference at every stage means the zero has moved. Confirm from the benchmark that the staff gauge has not moved, then reset the offset and note the date.
- A difference that changes with level is not a zero problem: suspect tilt, a beam touching a pier or bank at some levels, or a moving bracket.
- A jump on a known date points to something physical: a bracket knocked in a flood, or work on the bridge.
ISO 4373 sets out functional requirements for water level measuring devices, including non-contact ones using electromagnetic waves [7], and is a useful basis for an acceptance test. Plot sensor minus staff gauge over time: it shows drift long before it is obvious in the record (see data quality control for hydromet time series).
Power, enclosure, cables and lightning
The enclosure usually sits on the parapet or a short pole on the footpath, with the solar panel above it. Check that lamp posts, trees or the winter hillside do not shade the panel; sizing is covered in sizing solar power for an off-grid monitoring station.
Run the sensor cable along the bracket in conduit, clamped so it cannot whip or chafe, with a drip loop below each entry, and bring all cables in at one point. A metal bracket over an open valley is exposed, so bond and earth it and fit surge protection on power and signal lines, as described in lightning and surge protection for remote field stations.
Commissioning checklist
Before leaving the bridge, check and record:
- Clearance above HFL measured, and greater than the dead band plus the margin you chose.
- Level radar plumb, checked with an inclinometer, adjustment locked.
- Beam clear at the lowest water: footprint and side-lobe cone away from piers, walls, deck edge, cables and vegetation.
- Velocity radar tilt measured with an inclinometer, horizontal angle to the flow measured, and both entered in the configuration.
- Velocity footprint over the main flow, clear of the pier wake, checked at low and high water if possible.
- Zero set: staff gauge and radar read together, offset calculated, sensor reference point levelled from a benchmark.
- First readings sensible: level matches the staff gauge; velocity has the expected sign and size; both steady over several minutes.
- Bracket, anchors and cables tight and clamped, enclosure sealed.
- Earthing and surge protection connected.
- Data arriving at the server with correct time stamps (see time stamps you can trust).
- Photographs of the bracket, the beam's view of the water, the staff gauge and the enclosure, filed with the station record. At the post-monsoon visit they show at a glance whether anything has moved.
Key points
- Choose the reach, then the bridge side and span: straight, stable, free of backwater, mid-span over the main flow.
- Mount the level radar plumb on a stiff bracket, above the HFL by more than its dead band plus a margin, with outreach enough for a clear beam at the lowest water.
- Aim the velocity radar along the flow at a measured tilt, usually 30–60°, at rippled water clear of the pier wake; the reading is divided by cos α.
- Set the zero against the staff gauge, and check it against the gauge at every visit.
- Earth the bracket, protect the cables and photograph everything.
Where ClimMaTech fits
This is the procedure we follow when we fix our radar sensors to bridges. TARANG is our AWLR (Automatic Water Level Recorder), a non-contact radar level sensor with integrated data logging. PRAVAAH is our non-contact discharge sensor: an AWLR and an SVR (Surface Velocity Radar) in one system, which, with a surveyed cross-section and a site-calibrated velocity coefficient, reports discharge as well as level and surface velocity.
References
- World Meteorological Organization, Manual on Stream Gauging, Volume I: Fieldwork, WMO-No. 1044, 2010. Chapter 2 (selection of gauging station sites), section 4.7.1 (stage station site selection), section 5.6.9 (current-meter measurements from bridges) and section 8.10 (radar methods). old.wmo.int
- Central Water Commission, National Surface Water Data Center, Gauge and Discharge Measurement Field Manual (Hydrology Project), CWC, January 2005. Sections on digital water level recorders and on current-meter gauging from bridges. cwc.gov.in
- M. Welber, J. Le Coz, J. B. Laronne, G. Zolezzi, D. Zamler, G. Dramais, A. Hauet, M. Salvaro, Field assessment of noncontact stream gauging using portable surface velocity radars (SVR), Water Resources Research 52(2), 1108–1126, 2016. doi:10.1002/2015WR017906
- J. Fulton, J. Ostrowski, Measuring real-time streamflow using emerging technologies: Radar, hydroacoustics, and the probability concept, Journal of Hydrology 357(1–2), 1–10, 2008. doi:10.1016/j.jhydrol.2008.03.028
- Central Water Commission, Standard Operating Procedure for Flood Forecasting, Ministry of Jal Shakti, Government of India, April 2025. cwc.gov.in
- F. Alimenti, S. Bonafoni, E. Gallo, V. Palazzi, R. Vincenti Gatti, P. Mezzanotte, L. Roselli, D. Zito, S. Barbetta, C. Corradini, D. Termini, T. Moramarco, Noncontact measurement of river surface velocity and discharge estimation with a low-cost Doppler radar sensor, IEEE Transactions on Geoscience and Remote Sensing 58(7), 5195–5207, 2020. doi:10.1109/TGRS.2020.2974185
- International Organization for Standardization, ISO 4373:2022 Hydrometry: Water level measuring devices, ISO, 2022. iso.org