
Groundwater level monitoring with telemetry
How piezometers, pressure sensors and telemetry turn a few visits a year into a continuous record of what is happening underground.

A well that was 12 m deep to water last year is 15 m this year. Is that a drought, a neighbour's new tube well, or a reading taken on a different day with a different tape? Groundwater level monitoring answers questions like this, but only if the measurements are frequent, consistent and trusted. This article explains how groundwater levels are measured, what a groundwater level monitoring system with telemetry consists of, and where the numbers go in India.
Why measure groundwater levels at all?
Groundwater supplies most of the minor irrigation schemes in India: the Central Ground Water Board (CGWB) quotes 94.8 % of them, and groundwater's share in irrigation rose from 61 % in 2007-08 to 64 % in 2016-17 [2]. Its assessment of dynamic groundwater resources for 2023 classes 736 of 6,553 assessment units (11.2 %) as over-exploited and 199 (3 %) as critical [2].
The water level in a well is the most direct indicator of this stress. It reflects recharge from rain and canals, pumping, and the geology around the well. CGWB expresses it as depth to water, measured below ground level [1]. A rising depth means the water table or the pressure in a confined aquifer is falling.
A single reading says little. The USGS, in its guide to long-term monitoring, notes that a record of one or more decades is typically needed to capture the range of fluctuation in a well and to track trends, and that a hydrograph built from infrequent measurements with long gaps is "difficult to interpret and may lead to biased or mistaken interpretations" [3]. That is the case for continuous monitoring.
What is a piezometer?
A piezometer is a well built specially to measure water level (pressure head) at a chosen depth in an aquifer. CGWB's national network of about 25,000 stations, the National Hydrograph Network Stations, consists of open dug wells and purpose-built bore or tube wells it calls piezometers [1]. A dug well shows the water table in the weathered zone near the surface. A piezometer is open only over a screened or open interval, so it reports the level of the aquifer at that depth. Where several aquifers lie one over another, they can differ in level, which is why the depth and construction of each station matter and must be recorded.
The pressure that governs everything below is plain hydrostatics: a column of water 1 m high exerts about 9.81 kPa.
How is groundwater level measured?
There are three practical ways to measure the level in a well.
- Manual measurement with a tape or dipper. A graduated steel tape or an electric water-level sounder is lowered until it touches the water, and the depth is read against a fixed measuring point at the top of the casing. This is the reference method and needs a person at every well. CGWB's own network is visited four times a year, in March/April/May, August, November and January [1]. For community use, the Jaldoot app lets Gram Panchayats record well levels [1].
- Pressure-sensor loggers. A submersible pressure sensor hangs on a cable at a known depth, measures the pressure of the water above it, and a logger records the result every few minutes or hours. In India these are called Digital Water Level Recorders (DWLR).
- Telemetry on top of the logger. The logger sends its records over a mobile network to a server, so nobody has to visit to collect them.
Methods 2 and 3 do not replace method 1. The USGS guide on submersible pressure transducers recommends measuring the water level in the well periodically with a calibrated tape to check the sensor for drift [4]. The tape is the check on the sensor.
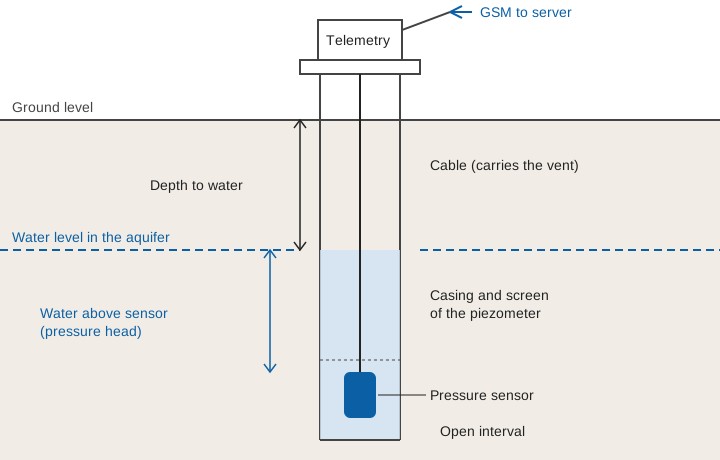
How does a groundwater level sensor work?
A groundwater level sensor of this kind is a pressure sensor. It measures the pressure of the water column above it and converts it to a height. Two designs exist, and the difference matters:
- Vented (gauge) sensors have a thin tube inside the cable that lets the air pressure reach the back of the sensing element. They measure only the pressure due to the water, so they are self-compensating as long as the vent stays dry and unobstructed [4].
- Absolute (non-vented) sensors measure water plus the atmosphere above it. Their output must be corrected using a recorded barometric pressure [4].
The calculation is short:
Water column above sensor:   h = (P_sensor − P_air) / (ρ × g)

Depth to water below the measuring point = cable length to the sensor − h
ρ = 1000 kg/m³ (fresh water),  g = 9.81 m/s²
Worked example (illustrative). An absolute sensor hangs on a cable so that it sits 30.00 m below the measuring point. It reads 150.2 kPa, and a barometer logging at the surface reads 100.0 kPa.
Gauge pressure   = 150.2 − 100.0 = 50.2 kPa = 50,200 Pa
Water above sensor h = 50,200 / (1000 × 9.81) = 5.12 m
Depth to water   = 30.00 − 5.12 = 24.88 m below the measuring point
If the barometric correction were forgotten, the sensor would appear to have 150.2 / 9.81 = 15.3 m of water above it. The result would be 14.7 m to water instead of 24.88 m, which is a ten-metre error from one missing correction. Even a normal swing of 1 kPa in air pressure between a low and a high would shift an uncorrected reading by about 0.10 m. That is why barometric compensation is not optional.
Other things can move a reading. Sensors drift, their output changes with temperature, and a cable can stretch or slip. The USGS therefore advises checking drift by periodically measuring the well with a calibrated tape, applying the offset to the record, and keeping the raw data [4]. Our guide to data quality control for hydromet time series describes the same checks for any water record.
What does telemetry add to groundwater level monitoring?
Telemetry adds time and awareness. A logger alone gives a complete record, but only after someone drives to the well, connects to it and downloads the file. A telemetered one reports every few hours.
CGWB describes this chain for its high-frequency network under the National Hydrology Project. DWLRs with telemetry record water level, and the six-hourly readings travel to a central server through the Water Information Management System (WIMS), run by the National Water Informatics Centre under the Ministry of Jal Shakti. They are then shared with the public on India-WRIS [1]. The target under that project is 5,260 DWLRs, and further piezometers fitted with DWLRs and telemetry are planned [1]. State networks are being strengthened in the same way, and piezometers with DWLRs are also being installed under the Atal Bhujal Yojana where it operates [1].
CGWB's Climate Response Monitoring Network along the Tamil Nadu coast shows what that looks like in practice. It has 60 piezometers with telemetric DWLRs, 30 to 300 m deep, which report water level, electrical conductivity and temperature every six hours to a regional data centre and on to WIMS. The aim is to trace the effect of climate and pumping on levels and to map seawater intrusion [1].
Telemetry brings three practical benefits:
- Faster detection. A pumping-related decline, a sudden jump from a damaged sensor, or a dead battery is seen within hours, not after the next visit.
- A hydrograph that can be read. A record every few hours shows the response of the well to a single storm or pumping cycle, which four visits a year cannot.
- Fewer wasted trips. Wells that report normally can be left alone, and visits can be directed to those that do not.
The chart below, with an illustrative seasonal pattern, shows what is lost between visits.
Designing a groundwater level monitoring system
A good station depends as much on its set-up as on the sensor:
- Choose and record the well. The USGS advises that observation wells be inspected for construction defects, hydraulically tested to confirm they respond to the aquifer, and kept with a permanent file of construction, coordinates and datum [3]. A silted or clogged well records what the well does, not what the aquifer does.
- Fix the datum. Inaccurate datums are, in the USGS's words, a major source of error when levels are used for water-table maps and models [3]. Survey the measuring point to a benchmark. We explain the pitfalls in gauge zero, datum and benchmarks.
- Choose the interval. Telemetry makes frequent reporting cheap, but the sensor can still log faster than it transmits. Logging every 15 minutes while sending every six hours stores 96 readings a day and sends them in four batches. Reliable clocks matter: see time stamps you can trust.
- Plan the link and the power. Wells are often in fields, away from towers, so network coverage and power need checking before a site is chosen. Telemetry link design covers GSM, LoRa and satellite options.
- Calibrate with tape visits. Keep a schedule of manual checks, and apply drift corrections as described above [4].
- Know where the data goes. The path from device to dashboard is described in from sensor to screen.
How groundwater levels link to the wider picture
Level data are one input to the aquifer picture. CGWB's National Aquifer Mapping and Management Programme (NAQUIM), started in 2012, aims to delineate aquifers horizontally and vertically, characterise their properties, assess resource availability and quality, and develop management strategies [5]. Its method combines geological, geophysical, hydrogeological, hydrological and water quality studies, and the behaviour of water levels is one of the items it integrates [5]. Telemetered levels give that behaviour a time axis: how fast an aquifer recovers after the monsoon, and whether last year's low is this year's starting point.
Key points
- Groundwater level is measured as depth to water below ground level, from a fixed measuring point on a well or piezometer.
- Manual tape or dipper readings remain the reference. DWLR loggers record frequently, and telemetry delivers the data without a site visit.
- A pressure sensor gives the height of water above itself. Vented sensors compensate for air pressure automatically, and absolute ones need a barometric record.
- Datum, well condition, drift checks and clock accuracy decide whether a record can be trusted.
- In India, telemetered DWLR data flow from CGWB and state piezometers to WIMS and India-WRIS.
Where ClimMaTech fits
At ClimMaTech we build telemetry for surface-water hydromet stations. Tarang is a non-contact radar level sensor that works from above the water on rivers, reservoirs and drains. It is not a downhole groundwater sensor, and we do not offer it as one. The thinking in this article about datums, drift checks, clocks and the sensor-to-server chain applies to any water-level station, and our RTDAS and hydromet telemetry page describes how that chain is put together.
References
- Central Ground Water Board, Ministry of Jal Shakti, Ground Water Level Monitoring (National Ground Water Monitoring Network, Climate Response Monitoring Network, other stations), cgwb.gov.in. cgwb.gov.in/node/1858
- Central Ground Water Board, Ministry of Jal Shakti, Aquifer Mapping (including irrigation shares and the 2023 assessment of dynamic ground water resources). cgwb.gov.in/en/aquifer-mapping
- C. J. Taylor, W. M. Alley, Ground-water-level monitoring and the importance of long-term water-level data, U.S. Geological Survey Circular 1217, 2001. pubs.usgs.gov/circ/circ1217
- L. A. Freeman, M. C. Carpenter, D. O. Rosenberry, J. P. Rousseau, R. Unger, J. S. McLean, Use of submersible pressure transducers in water-resources investigations, U.S. Geological Survey Techniques of Water-Resources Investigations 8-A3, 2004. pubs.usgs.gov/twri/twri8a3
- Central Ground Water Board, Ministry of Jal Shakti, National Aquifer Mapping and Management (NAQUIM) Programme: objectives and methodology. cgwb.gov.in/en/aquifer-mapping