
How flood risk is assessed: hazard, exposure, vulnerability
Flood risk is not the same as a flood: it combines how likely and how deep the water is, what lies in its path, and how badly it is harmed.

Two villages sit on the same river, and the same flood passes both. One loses a few sheds; the other loses homes, a school and a month's income. What differed was what stood in its path and how well it could take the water. This is the core of flood risk assessment: separating the flood itself from the damage it does, so that money and warnings go where the damage would be greatest. This article explains what flood risk means, how a flood risk map is built, how GIS is used, and where the numbers come from.
What does flood risk mean?
Flood risk is the potential for loss from floods over a period of time, judged by how likely floods are, what they would reach, and how easily that would be harmed. The UN's Sendai Framework terminology defines disaster risk as "the potential loss of life, injury, or destroyed or damaged assets which could occur to a system, society or a community in a specific period of time, determined probabilistically as a function of hazard, exposure, vulnerability and capacity" [1]. The IPCC says much the same in its own words: risks "result from dynamic interactions between climate-related hazards with the exposure and vulnerability of the affected human or ecological system" [2].
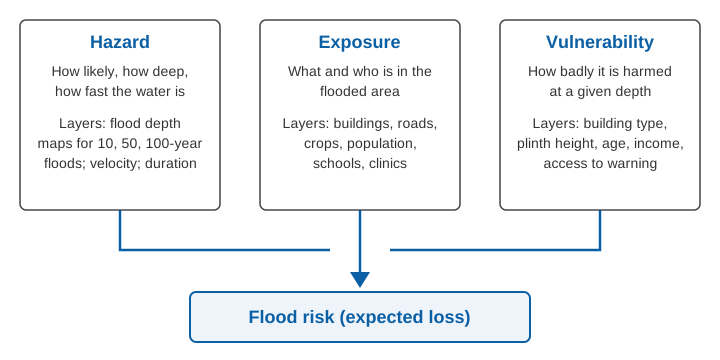
A flood is therefore not a risk. A flood in an uninhabited gorge is a hazard with no one to harm. A modest flood in a crowded, poorly built settlement can be a large risk. The three ingredients are:
- Hazard: "a process, phenomenon or human activity that may cause loss of life, injury or other health impacts, property damage, social and economic disruption or environmental degradation", characterised by its location, intensity or magnitude, frequency and probability [3]. For floods this means how often water reaches a place, how deep and fast it is, and how long it stays.
- Exposure: "the situation of people, infrastructure, housing, production capacities and other tangible human assets located in hazard-prone areas" [4]. It is a count of what is in the way: people, houses, roads, crops, a hospital.
- Vulnerability: "the conditions determined by physical, social, economic and environmental factors or processes which increase the susceptibility of an individual, a community, assets or systems to the impacts of hazards" [5]. A house on a raised plinth and a mud house at ground level share the same exposure but not the same vulnerability.
UNDRR adds a fourth term, capacity, the strengths and resources available to cope [1][5]. Warnings, shelters and trained volunteers sit here.
How is flood risk assessed?
Flood risk is assessed in four steps: describe the hazard, map the exposure, estimate the vulnerability, and combine them into expected loss or a risk index.
Step 1: Hazard, from river records to flood depth
The hazard step answers "how likely is water to reach this place, and how deep will it be?" It starts with flows. Annual peak discharges from a gauged site are fitted to a probability distribution to estimate the flood for a chosen return period, such as the 100-year flood, which has a 1 % chance of being equalled or exceeded in any year. We explain this and its limits in what a "100-year flood" really means. A hydraulic model then spreads each design flow over the terrain and produces water depth, and sometimes velocity, for every grid cell. The result is a set of hazard maps, one per return period; see flood hazard maps and floodplain zoning.
One trap: past floods are not a fixed guide to future ones. Our review of nonstationary flood frequency analysis covers the methods and models that allow the flood distribution itself to change over time [6]. In our projections for 128 Indian basins under CMIP6 climate models, high flows become more frequent and last longer, which we link to greater flood risk [7]. See also climate change and Indian floods.
Step 2: Exposure, from satellites and surveys
Exposure is a layer of assets laid over the hazard map: building footprints, population grids, roads, bridges, farmland, schools, health centres, power and water installations. Global studies use gridded population and GDP datasets together with land use, and many have moved from coarse grids of up to about 0.5° to finer resolutions [8].
Step 3: Vulnerability, from depth-damage curves and social factors
Physical vulnerability is usually expressed as a depth-damage function: the fraction of an asset's value lost at each water depth. A review of global risk assessments found that flood studies mostly use depth-damage functions, and that for coastal flooding a single global function is often applied [8]. The European Commission's Joint Research Centre publishes a global database of such curves with maximum damage values by country, intended for places without a local damage model [9]. Social vulnerability, such as age, poverty, disability and access to warnings, is handled through indicators rather than curves. It matters because the same depth hurts a household with no savings far more.
Step 4: Combine
The combination takes one of two forms. A quantitative assessment multiplies hazard by exposure by vulnerability to give a loss in rupees for each scenario, then integrates across probabilities to give an expected annual damage. An index-based assessment scores each factor, weights them and combines them into a relative flood risk index. India's national flood guidelines, issued by the National Disaster Management Authority (NDMA) in 2008, call for large-scale maps showing the areas inundated by floods of different frequencies, and for flood hazard and risk maps to be prepared [10].
How is GIS used in flood risk assessment?
A geographic information system (GIS) holds each layer as a map on a common grid and lets you overlay and calculate on them. Flood risk assessment using GIS typically runs like this:
- Build a terrain model from a digital elevation model (DEM) and delineate the catchment; see catchments and watersheds.
- Produce hazard layers: flood depth for chosen return periods from a hydraulic model, or flood extent from satellite imagery of past events.
- Overlay building, population and land-use layers to count what is flooded in each scenario.
- Apply depth-damage functions or vulnerability scores to each cell, and sum by village, ward or district.
Many Indian studies use a multi-criteria approach. In a study of Coochbehar district in West Bengal, Chakraborty and Mukhopadhyay used the analytic hierarchy process, a method of weighting criteria by pairwise comparison, to build a flood hazard index and a flood vulnerability index, and combined them into a flood risk index. Of the district's settlements, 58 (4.91 %) scored high on risk, 145 (12.29 %) moderate and 456 (38.64 %) low [11]. Such indices rank places, but the weights are the analyst's judgement and they cannot say how many rupees are at stake; a hydraulic model with damage curves can, but needs surveyed terrain and calibrated flows.
What map data does India use?
The NDMA guidelines recommend maps at 1:10,000 or 1:15,000 scale with contours at 0.3 m or 0.5 m intervals, reference river gauges against which inundated areas are determined, and zones liable to inundation by floods of different frequencies [10]. They record that the Central Water Commission began a programme of surveying flood-prone areas with the Survey of India in 1978, and that of 106,000 km² identified as prone to frequent floods, about 55,000 km² had been surveyed at the time of writing [10].
A worked example: expected annual damage
The example below is illustrative. It shows how the three factors combine. Take a hamlet of 40 houses in the floodplain, each worth ₹6 lakh. The hazard step gives four scenarios; the vulnerability step gives a damage fraction for each flood depth at the houses.
| Flood (annual chance) | Depth at houses | Damage fraction | Loss per house | Loss, 40 houses |
|---|---|---|---|---|
| 5-year (20 %) | below plinth | 0 | 0 | 0 |
| 10-year (10 %) | 0.2 m | 0.05 | ₹0.30 lakh | ₹12 lakh |
| 50-year (2 %) | 0.8 m | 0.25 | ₹1.5 lakh | ₹60 lakh |
| 100-year (1 %) | 1.5 m | 0.45 | ₹2.7 lakh | ₹108 lakh |
The expected annual damage is the area under the curve of loss against annual probability. Using the trapezoid rule between the points:
20 % to 10 %:  (0.20 - 0.10) × (0 + 12)/2    = 0.60 lakh
10 % to  2 %:  (0.10 - 0.02) × (12 + 60)/2   = 2.88 lakh
 2 % to  1 %:  (0.02 - 0.01) × (60 + 108)/2  = 0.84 lakh
Expected annual damage                        = 4.32 lakh per year
Floods rarer than 1 % are left out, so this slightly understates the true value. Now change one factor at a time:
- More exposure. Twenty new houses are built in the same zone: 60 houses, so 4.32 × 60/40 = 6.48 lakh per year.
- Lower vulnerability. The original 40 houses are raised on plinths 0.5 m higher. Depths at the houses fall to 0, 0.3 m and 1.0 m, with illustrative damage fractions of 0, 0.10 and 0.35, giving losses of 0, 24 and 84 lakh in the 10, 2 and 1 % scenarios. The expected annual damage becomes 0.08 × 24/2 + 0.01 × (24 + 84)/2 = 0.96 + 0.54 = 1.50 lakh per year.
The hazard never changed in either case. This is why the NDMA guidelines stress regulating land use in floodplains. They report that average annual flood damage over 1996 to 2005 was ₹4,745 crore, against ₹1,805 crore for the previous 53 years, attributed to population growth, urbanisation, development in flood plains and global warming [10].
Probability over time
A 1 % annual chance sounds remote, but over a 30-year period the chance of at least one such flood is 1 − 0.99³⁰ = 1 − 0.740 = 26 %.
Limits of flood risk assessment
- Hazard is often only depth. Global-scale reviews note that hazard is frequently represented by depth alone, leaving out velocity, duration and rate of rise, and that reliable loss data for validation remain scarce [8].
- Flash floods are hard to map. A hazard map gives no timing; real-time monitoring takes over there, and impact-based warnings use the risk map to decide whom to alert.
- Insurance rarely uses it. The NDMA noted in 2008 that insurers charged a uniform premium irrespective of flood zone, for want of the basic data needed for fair rates by flood risk [10].
Key points
- Flood risk combines hazard (the water), exposure (what is in its path) and vulnerability (how badly it is harmed), as UNDRR and the IPCC both define it.
- Hazard comes from flood frequency analysis and hydraulic modelling; exposure from surveys and satellite data; vulnerability from depth-damage curves and social indicators.
- GIS overlays these layers and can produce a quantitative loss estimate or a relative risk index.
- Reducing exposure (land-use rules) or vulnerability (plinths, warnings) lowers risk without changing the river.
- An assessment is only as good as its inputs: hazard maps need current terrain and gauge records.
Where ClimMaTech fits
A risk map shows where floods would hurt; it does not say when one is under way. At ClimMaTech we build the monitoring side: river level and surface velocity at gauging sites, with community alerts. Our flood warning solution describes how these measurements support warnings for the places an assessment has identified as most at risk.
References
- United Nations Office for Disaster Risk Reduction (UNDRR), Sendai Framework Terminology on Disaster Risk Reduction: "Disaster risk", 2017. undrr.org
- IPCC, Annex II: Glossary, in Climate Change 2022: Impacts, Adaptation and Vulnerability, Working Group II contribution to the Sixth Assessment Report, Cambridge University Press, 2022 (entry "Risk"). ipcc.ch
- UNDRR, Sendai Framework Terminology on Disaster Risk Reduction: "Hazard", 2017. undrr.org
- UNDRR, Sendai Framework Terminology on Disaster Risk Reduction: "Exposure", 2017. undrr.org
- UNDRR, Sendai Framework Terminology on Disaster Risk Reduction: "Vulnerability", 2017. undrr.org
- S. Barbhuiya, M. Ramadas, S. S. Biswal, Nonstationary Flood Frequency Analysis: Review of Methods and Models, in River, Sediment and Hydrological Extremes: Causes, Impacts and Management, Springer, 2023, pp. 271–288. doi:10.1007/978-981-99-4811-6_15
- V. Sharma, S. Barbhuiya, V. Gupta, Projections of Future Streamflow for India Informed by CMIP6 Global Climate Models, Hydrological Processes 40(3), e70476, 2026. doi:10.1002/hyp.70476
- P. J. Ward et al., Review article: Natural hazard risk assessments at the global scale, Natural Hazards and Earth System Sciences 20, 1069–1096, 2020. doi:10.5194/nhess-20-1069-2020
- J. Huizinga, H. de Moel, W. Szewczyk, Global flood depth-damage functions: Methodology and the database with guidelines, EUR 28552 EN, Joint Research Centre, Publications Office of the European Union, 2017. publications.jrc.ec.europa.eu
- National Disaster Management Authority, Government of India, National Disaster Management Guidelines: Management of Floods, 2008 (foreword; sections on flood insurance, flood plain zoning and survey of flood-prone areas). ndma.gov.in
- S. Chakraborty, S. Mukhopadhyay, Assessing flood risk using analytical hierarchy process (AHP) and geographical information system (GIS): application in Coochbehar district of West Bengal, India, Natural Hazards 99(1), 247–274, 2019. doi:10.1007/s11069-019-03737-7