
Total cost of a monitoring network: beyond the price tag
Where the money goes over a station's ten-year life, why networks decline when operation and maintenance is under-funded, and how to budget so that yours does not.

When a department sanctions a monitoring network, the number everyone discusses is the purchase price: so many stations at so much each, installed and commissioned. That number is real, but it is only part of the story. A river gauge or a rain gauge has to report every fifteen minutes for a decade, through monsoon floods, landslides that close the road, winter cold, lightning and theft. Each of those years costs money, and published estimates show that over a decade the money spent after commissioning is larger than the money spent before it.
This article sets out where the money goes over a network's life, using a ten-year horizon. It summarises what programme reviews have found, gives an illustrative cost structure with its assumptions, lets you change the key inputs, and ends with a budgeting checklist.
The purchase price is the visible part
Total cost of ownership (also called life-cycle cost) is the sum of everything an organisation spends on an asset from planning to disposal: buying, installing, operating, maintaining, renewing and finally removing it. Operation and maintenance (O&M) is the part spent after the network is commissioned to keep it producing data.
Published programme documents agree that O&M is large compared with the initial investment, even though they cost different things:
| Source | What was costed | Recurring cost compared with investment |
|---|---|---|
| World Bank appraisal of India's National Hydrology Project (2017) [7] | Hydromet hardware bought under the project | Annual O&M of all hardware estimated at 10 % of the cost of the project's main investment component (Component A); hardware life 10 years, replaced in years 10 and 20 |
| Kull and others, World Bank (2021) [6] | Surface weather stations for the WMO Global Basic Observing Network | Annual operating cost of a station assumed to be a quarter of the cost of a new one; network life 20 years |
| Same study, global totals [6] | Upgrading surface and upper-air observing networks in under-monitored countries | Capital investment of US$361 million and annual operating costs of US$166 million |
| Rogers and Tsirkunov, World Bank (2013) [1] | Modernising national meteorological and hydrological services in developing countries | At least US$1.5–2.0 billion of investment, plus a minimum of US$400–500 million per year for staff and O&M |
| WMO, World Bank and USAID (2015), Haiti example [5] | An existing national observation system | Network operations "constituting some 85% of total costs" |
The Rogers and Tsirkunov figures mean that every year of operation costs between a fifth and a third of the one-off investment (400 ÷ 2,000 = 20 %; 500 ÷ 1,500 = 33 %). Over ten years the recurring bill is two to more than three times the investment. The economic guide published by WMO with the World Bank and USAID puts the lesson plainly: when buying new equipment, "due attention should be paid to maintenance costs in addition to the initial investment cost" [5].
Where the money goes: twelve cost categories
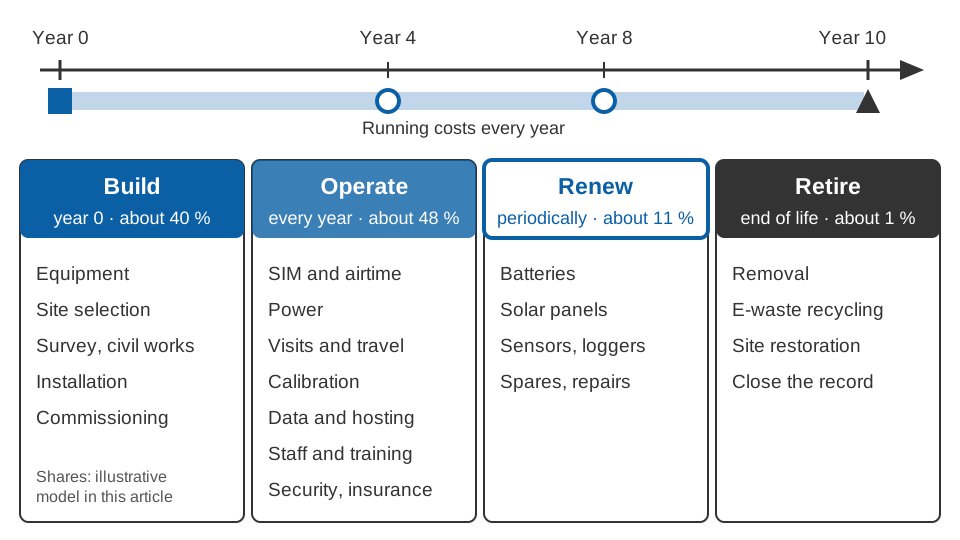
Build (year 0)
- Equipment. Sensors, the data logger (built into most modern monitoring devices), modem, solar panel, battery, enclosure, mast and surge protection. This is usually the only line compared in a tender.
- Site selection and civil works. Reconnaissance, permissions from the bridge or land owner, a levelled benchmark and cross-section survey, foundations, brackets, fencing and safe access for maintenance staff.
- Installation and commissioning. Transport, the installation crew, testing, an acceptance period, and recording the station's metadata (location, datum, sensor serial numbers).
Operate (every year)
- Telemetry charges. Monthly SIM data plans for cellular links, or airtime for satellite links where there is no coverage. They recur for the whole life of the station, so the choice of link is also a choice of recurring cost. See telemetry link design.
- Power. Small at an off-grid solar site, apart from cleaning panels; a recurring bill where a station runs from the grid. A correctly sized system avoids repeat visits to dead stations; see sizing solar power for an off-grid station.
- Routine maintenance visits and travel. The Manual on the WMO Integrated Global Observing System (WIGOS) requires regular preventive maintenance, with the schedule set by the type of system, the site's environment and the instruments installed, and corrective maintenance "as soon as practically possible" after a failure [4]. In the hills a single visit can take a two-person team a full day of driving and walking, and monsoon landslides can stretch that. Our post-monsoon maintenance checklist lists what each visit should cover.
- Calibration. The same Manual requires that instruments be "calibrated regularly in accordance with adequate procedures" [4]. For a water-level station that means checking against the staff gauge and benchmark; for a rain gauge, a field calibration; for discharge, repeated gaugings to keep the rating curve current.
- Data management, software and hosting. Servers or cloud hosting, the database, quality control, backups, software licences and security updates. See what an RTDAS is.
- Staff and training. A network manager, technicians and data checkers, and refresher training as people change posts.
- Security and insurance. Fencing, a local caretaker where one is used, and insurance against flood, lightning, theft and vandalism.
Renew (periodically)
- Spares and replacements. Batteries wear out within a few years; panels, sensors, modems and surge protectors fail or reach the end of their life. A stock of spares near the network shortens outages.
Retire (end of life)
- End of life. Removing the station, sending batteries and electronics to an authorised recycler, restoring the site, and closing the station's record so that its data remain usable.
An illustrative ten-year cost structure
The numbers below are an illustrative worked example, not a quotation. To avoid currency, every cost is in relative units, where the equipment for one station costs 100. Assumptions: a network of 20 stations in hill terrain, four maintenance visits per station per year, a ten-year asset life for the electronics, constant prices and no discounting.
| Cost category | Assumption (relative units) | 10-year total per station | Share |
|---|---|---|---|
| Equipment | 100, once | 100 | 27.2 % |
| Site selection and civil works | 30, once | 30 | 8.2 % |
| Installation and commissioning | 15, once | 15 | 4.1 % |
| Telemetry | 2 per year | 20 | 5.4 % |
| Power | 0.5 per year | 5 | 1.4 % |
| Maintenance visits and travel | 4 visits a year × 2 per visit | 80 | 21.8 % |
| Spares and replacements | spares 3 per year; a battery (5) in years 4 and 8 | 40 | 10.9 % |
| Calibration | 2 per year | 20 | 5.4 % |
| Data, software and hosting | 1 per station per year, plus 15 per year for the platform shared by 20 stations | 17.5 | 4.8 % |
| Staff and training | 40 per year for the network, shared by 20 stations | 20 | 5.4 % |
| Security and insurance | 1.5 per year | 15 | 4.1 % |
| End of life | 5, once | 5 | 1.4 % |
| Total | 367.5 | 100 % |
Three results stand out:
- Equipment is about a quarter of the total (27 %). The three build items together are 39.5 %; the remaining 60.5 % is O&M.
- Field visits are the largest recurring item (22 %), almost as large as the equipment itself. In the hills it is also the item most sensitive to terrain and weather.
- The yearly O&M is about 22 % of the equipment price (222.5 ÷ 10 years ÷ 100). That sits between the National Hydrology Project's 10 % for hardware O&M alone [7] and the 25 % assumed per station by Kull and others [6], which is reasonable because our example includes staff, data and calibration.
Ten-year total per station  = build + 10 × yearly running cost + renewals + end of life
                            = 145 + 10 × 17.75 + 40 + 5 = 367.5
O&M share                   = (367.5 − 145) ÷ 367.5 = 60.5 %
Yearly running cost         = 2 + 0.5 + (4 × 2) + 2 + 1.5 + 1 + (15 + 40) ÷ 20 = 17.75
By the end of year 3, cumulative spending on a station is about twice its equipment price, and by year 10 it is 3.7 times.
Try it: what changes the O&M share
Three inputs move the result most: how many stations share the fixed costs of the platform and network manager, how often each station is visited, and how long the electronics last. Change them below.
With the other inputs at their defaults, the model gives:
| Change | O&M share of the ten-year cost |
|---|---|
| Default (20 stations, 4 visits a year, 10-year life) | 61 % |
| 5 stations instead of 20 | 68 % |
| 100 stations instead of 20 | 58 % |
| 1 visit a year instead of 4 | 53 % |
| 12 visits a year (monthly) instead of 4 | 73 % |
| Electronics last 7 years instead of 10 | 65 % |
| Electronics last 5 years instead of 10 | 69 % |
Small networks carry a heavy share of fixed costs, because a data platform and a network manager cost much the same for five stations as for twenty. And cutting visits lowers the O&M share on paper, but only by moving cost into failures: a station that is not visited is a station that eventually stops reporting.
Why under-funded O&M is a leading cause of network decline
Rogers and Tsirkunov list, among the main reasons why internationally supported modernisation had "achieved only limited success", a "preoccupation with project time-scale installation of hardware without adequate provision for training, ongoing maintenance, consumables, and other continuing technical support" [1]. They describe the end state bluntly: stations are "successfully installed, but staff members receive a limited amount of training in maintaining them. Ultimately, the station ceases to function, owing to lack of funding for spare parts, lack of integration into the existing observing network, or lack of trained staff members" [1].
The Alliance for Hydromet Development's Hydromet Gap Report 2021 found the same in its country assessments: "Government budgets for NMSs are often substantially below their staffing and operating costs, often leading to the neglect of essential maintenance of equipment and technology, and a reliance on external funding" [2]. It notes that externally funded projects expect the country to "cover the long-term operations and maintenance costs" once the project ends, and that the availability of radiosonde data over Africa dropped by 50 % between 2015 and 2020 [2]. A review of hydrometric network design also opens with documented examples of declining network density [10].
The mechanism is a downward spiral. A station that is not maintained produces gaps; gaps erode users' trust; low trust weakens the case for the next year's budget; and a smaller budget means fewer visits. The Gap Report calls the institutional version of this a "low-resource trap" [2].
What the response looks like
The WMO's rules for observing systems make the point directly. The Manual on WIGOS requires Members to "plan and operate their networks in a sustainable and reliable manner" and adds: "Sustainability over at least a ten-year period is recommended; however, this depends on paying sufficient attention to maintenance and operations following the establishment of the network" [4].
The Systematic Observations Financing Facility (SOFF), set up by WMO, UNDP and UNEP, is designed around this problem. Its investment-phase funding includes the budget for O&M during the first year after installation, and in its compliance phase it pays countries annual results-based finance, calculated at a standardised rate per station, for stations whose data are verified as collected and exchanged internationally [3]. In other words, it pays for stations that keep working, not for stations that are installed.
India has learned the same lesson. Under the second Hydrology Project, procurement required at least two years of warranty followed by at least three years of comprehensive annual maintenance contracts (AMCs), with the AMC cost included in bid evaluation; the World Bank's completion report found that this "improved the quality and sustainability of equipment and software systems" [8]. The National Hydrology Project went further, requiring "comprehensive warranty and/or O&M services for 5–10 years" for most procurements [7]. By January 2025 its implementing agencies were operating 12,540 monitoring stations providing validated data online, against an end target of 7,630, while the Bank continued to rate the risk to institutional capacity for implementation and sustainability as substantial [9]. Contracts carry the network for their duration; after that, the cost sits in the agency's own budget, and it has to be planned for.
A checklist for budgeting
Use this for an estimate, a tender or a funding proposal (see also writing a technical specification for a hydromet tender):
- Set the horizon. Budget for at least ten years, in line with the WIGOS recommendation [4], not for the project period.
- Cost all twelve categories, including those that sit in other departments' budgets (vehicles, staff salaries, server rooms).
- Price visits from the map, not the catalogue. Estimate travel time to each site in the monsoon, the team size and the number of visits per year.
- Plan renewals by component life. Batteries, panels and electronics have different lives; set up a sinking fund rather than waiting for failures.
- Hold spares for the most common failures, stored close to the network.
- Budget calibration and gaugings as recurring items, with the instruments and staff time they need.
- Fix the recurring telemetry and hosting costs for the full horizon, and check who pays them after the project ends.
- Name the staff who will manage the network and check the data, and budget refresher training.
- Include security and insurance, especially for exposed sites near settlements or roads.
- Write O&M into the contract where possible: warranty, a multi-year comprehensive AMC, response times, and data availability as the measure of performance. Evaluate bids on life-cycle cost, not purchase price alone, as the Hydrology Project did with AMC costs [8].
- Secure the money after the contract ends, as a line in the regular budget rather than a hoped-for extension.
- Plan end of life: removal, recycling, site restoration and archiving the record.
Key points
- Over ten years, recurring costs match or exceed the initial investment in the published estimates summarised here, often by several times; in our illustrative example equipment is 27 % of the total and O&M about 60 %.
- Field visits and travel are the largest recurring item, especially in hill terrain.
- Small networks, frequent visits and short asset lives all raise the O&M share.
- International reviews identify installing hardware without funding maintenance, spares and training as a main reason networks decline.
- Multi-year maintenance contracts, results-based O&M finance and a ten-year budget horizon are the established responses.
At ClimMaTech we plan networks with their running costs in view from the first site visit, because a station is only useful while it reports. Our work on RTDAS and hydromet telemetry and on river monitoring covers networks of this kind.
References
- D. P. Rogers and V. V. Tsirkunov, Weather and Climate Resilience: Effective Preparedness through National Meteorological and Hydrological Services, Directions in Development, World Bank, 2013, pp. 2–3, 21–22, 25–27 and 52. doi:10.1596/978-1-4648-0026-9.
- Alliance for Hydromet Development, Hydromet Gap Report 2021, WMO, July 2021, chapters 5 and 6. wmo.int.
- Systematic Observations Financing Facility, SOFF Operational Manual, SOFF Secretariat (WMO), 2023, sections 4.5.2 and 4.5.3. un-soff.org.
- World Meteorological Organization, Manual on the WMO Integrated Global Observing System, Annex VIII to the WMO Technical Regulations, WMO-No. 1160, 2023 edition, updated in 2024, clauses 2.2.1.2, 2.4.7 and 2.4.9. WMO key WIGOS publications.
- World Meteorological Organization, World Bank Group and USAID, Valuing Weather and Climate: Economic Assessment of Meteorological and Hydrological Services, WMO-No. 1153, 2015, chapter 7 (section 7.5 and Box 7.2). documents.worldbank.org.
- D. Kull, L. P. Riishojgaard, J. Eyre and R. A. Varley, The Value of Surface-based Meteorological Observation Data, World Bank, WMO and Met Office, 2021, section 5.5. hdl.handle.net/10986/35178.
- World Bank, Project Appraisal Document: India National Hydrology Project, February 2017, section on sustainability and economic analysis annex. documents.worldbank.org.
- World Bank, Implementation Completion and Results Report: India Second Phase of the Hydrology Project, December 2014, paragraphs 33 and 35. documents.worldbank.org.
- World Bank, National Hydrology Project (P152698), Implementation Status and Results Report, sequence 17, 28 March 2025. documents1.worldbank.org.
- A. K. Mishra and P. Coulibaly, Developments in hydrometric network design: A review, Reviews of Geophysics 47 (2009), RG2001. doi:10.1029/2007RG000243.