
Urban flooding in India: why cities flood
How paving a city changes the way rain becomes runoff, how Indian storm drains are sized, why they are overwhelmed, and what planners can do about it.

An hour of heavy rain, and an underpass in an Indian city is underwater, traffic has stopped and low-lying streets are flooded. This article explains the causes of urban flooding in India: what paving does to runoff, how Indian storm drains are sized, why they are overwhelmed, and what the national manual and guidelines ask planners to do, with a worked example for one city block.
What is urban flooding?
Urban flooding is the inundation of streets, buildings and infrastructure in a town or city when rain falls faster than the drainage system can carry it away, or when a river, lake or the sea rises into the city. The National Disaster Management Authority (NDMA) treats it as a disaster in its own right, separate from river floods, because its causes and remedies are different. In NDMA's words, urbanisation "increases the flood peaks from 1.8 to 8 times and flood volumes by up to 6 times", so that flooding "occurs very quickly due to faster flow times, sometimes in a matter of minutes" [1].
NDMA's Guidelines on Management of Urban Flooding followed the Mumbai floods of July 2005 and were published in 2010 [1]. The CPHEEO Manual on Storm Water Drainage Systems (2019) of the Ministry of Housing and Urban Affairs is the national design reference for city drains [2].
Why do cities flood?
Cities flood because building a city changes three things at once: more of the rain runs off, it runs off faster, and the channels that are supposed to carry it are often smaller than the flow that arrives.
More runoff: imperviousness and the runoff coefficient
On open ground, much of the rain soaks into the soil. Roofs, roads and paved yards are impervious: water cannot soak through them, so nearly all of it runs off. The share of a catchment covered by such surfaces is its imperviousness.
Engineers capture this with the runoff coefficient, written C: the fraction of the rainfall that becomes peak runoff, from 0 (all absorbed) to 1 (all runs off). The CPHEEO manual gives these ranges for Indian design [2]:
| Surface or area | Runoff coefficient C |
|---|---|
| Commercial area | 0.70–0.95 |
| Industrial area | 0.60–0.90 |
| Residential, high density | 0.60–0.75 |
| Residential, low density | 0.40–0.60 |
| Parks and recreational areas | 0.10–0.25 |
| Asphalt pavement | 0.70–0.95 |
| Concrete roofs | 0.70–0.90 |
The manual asks designers to choose C for "the ultimate development of the catchment as per the master plan", not for today's land use [2], and NDMA asks for future systems to be designed with a runoff coefficient of up to 0.95, because underground drains are hard to enlarge once laid [1]. For a mixed area the coefficient is the area-weighted average of its parts [2].
Luna Leopold's 1968 guidebook for the US Geological Survey sets out the consequence: more impervious cover means more runoff, larger flood peaks and less groundwater recharge [3].
Faster runoff: a shorter time to peak
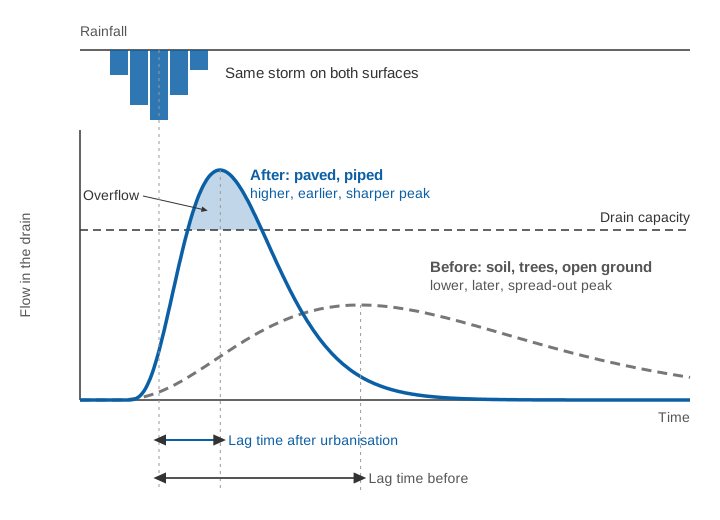
Water runs off a road far faster than it crosses a field, and faster still in a pipe or lined drain. Leopold notes that both effects shorten the lag time, the interval between the centre of the rainfall and the centre of the runoff, and that "as the time required for a given amount of water to run off shortens, the peak rate of runoff (flood peak) increases" [3]. The related time of concentration, the time water takes to travel from the farthest point of a catchment to its outlet, falls in the same way; how to estimate it is explained in time of concentration: why small catchments flood so fast.
A shorter time of concentration does double damage: the water arrives in less time, and the design rain becomes a shorter, more intense burst. Leopold's compilation of US data showed that, for a 1 square mile catchment, the mean annual flood of a fully sewered area rose from about 1.7 times the rural value at 0 % impervious to about eight times at 100 % impervious [3].
How are storm drains designed in India?
Indian storm drains are sized for a chosen design storm: the rainfall intensity, for a duration equal to the time of concentration, that is expected to be equalled or exceeded on average once in a stated number of years, the return period. The CPHEEO manual recommends these return periods [2]:
| Type of urban catchment | Class I cities (population 100,000 and above) | Other cities |
|---|---|---|
| Central business and commercial | once in 5 years | once in 2 years |
| Industrial | once in 5 years | once in 2 years |
| Urban residential | once in 5 years | once in 2 years |
| Airports and other critical infrastructure (railway stations, power stations) | once in 100 years | once in 50 years |
Where old drains cannot be rebuilt to this standard, the manual asks for rainwater harvesting and detention structures to take the excess. It also records how far practice has lagged: storm drainage in India is "currently designed … for rainfall intensities of once in one year to once in two years return periods", and where no rainfall records exist, intensities of 12–20 mm/h are commonly assumed [2].
The peak flow is then found with the rational method, which the manual says is used in most urban drainage design [2]:
Q = C × I × A / 360

Q = peak flow (m³/s)
C = runoff coefficient (0 to 1)
I = rainfall intensity for a duration equal to the time of concentration (mm/h)
A = catchment area (hectares)
The manual writes it as Qp = 10 C I A, in cubic metres per hour; dividing by 3,600 gives the form above. It applies to catchments up to about 8–10 km² and assumes uniform rain over the whole area for at least the time of concentration [2]. The intensity comes from an intensity-duration-frequency curve for the city, explained in IDF curves explained. The drain is then sized with Manning's formula, V = (1/n) R^(2/3) S^(1/2), where V is velocity (m/s), R the hydraulic radius (flow area divided by wetted perimeter, m), S the slope and n a roughness coefficient: 0.015 for brick in good condition or wood-troweled concrete [2].
A return period assumes a stable climate. In our review of flood frequency methods, we noted that changes in climate and land use have made that assumption unreliable, and that nonstationarity needs to be built into flood risk assessment [4]. Over central India, the frequency and magnitude of extreme monsoon rain events rose significantly from 1951 to 2000, even though seasonal totals showed no trend [5]. A drain designed for yesterday's five-year storm may now see it more often.
Worked example: one city block, then and now
The numbers in this example are illustrative, not from a real site.
A 10-hectare block drains to a single open drain. Thirty years ago it was 30 % roofs and roads and 70 % gardens and open ground. Today it is 70 % paved. Take C = 0.85 for roofs and roads and C = 0.20 for open ground, both inside the CPHEEO ranges [2].
Runoff coefficient.
Then: C = 0.30 × 0.85 + 0.70 × 0.20 = 0.255 + 0.140 = 0.395
Now:  C = 0.70 × 0.85 + 0.30 × 0.20 = 0.595 + 0.060 = 0.655
Design intensity. Paving has also shortened the time of concentration, from 40 minutes to 20 minutes. Suppose the city's five-year IDF curve gives 55 mm/h for 40 minutes and 75 mm/h for 20 minutes.
Peak flow.
Then: Q = 0.395 × 55 × 10 / 360 = 0.60 m³/s
Now:  Q = 0.655 × 75 × 10 / 360 = 1.36 m³/s
The same five-year storm now produces 2.3 times the peak flow. About 1.7 times comes from the higher runoff coefficient and about 1.4 times from the more intense rain that matches the shorter time of concentration.
Drain capacity. The drain is a rectangular brick channel 1.2 m wide and 1.0 m deep, on a slope of 1 in 1,000, with n = 0.015. Flowing full:
Clean:  A = 1.2 × 1.0 = 1.20 m², P = 1.2 + 2 × 1.0 = 3.2 m, R = 0.375 m
        Q = (1 / 0.015) × 1.20 × 0.375^(2/3) × 0.001^(1/2) = 1.32 m³/s
Silted, 0.3 m of silt and waste on the bed:
        A = 1.2 × 0.7 = 0.84 m², P = 1.2 + 2 × 0.7 = 2.6 m, R = 0.323 m
        Q = (1 / 0.015) × 0.84 × 0.323^(2/3) × 0.001^(1/2) = 0.83 m³/s
Thirty years ago the drain carried the five-year peak of 0.60 m³/s with a wide margin. Today, even clean, it is slightly too small for 1.36 m³/s. With 0.3 m of silt it overflows whenever the rain over 20 minutes exceeds 0.83 × 360 / (0.655 × 10) = 46 mm/h, which is a far more frequent storm. No single cause is to blame: paving, faster runoff and poor maintenance add up.
Try it yourself: change the paved share, the rainfall intensity and the silt depth, and watch the peak flow against the drain's capacity.
All figures in the calculator are illustrative: one 10 ha block, one drain, and runoff coefficients chosen from the ranges in the CPHEEO manual [2].
What are the causes of urban flooding in India?
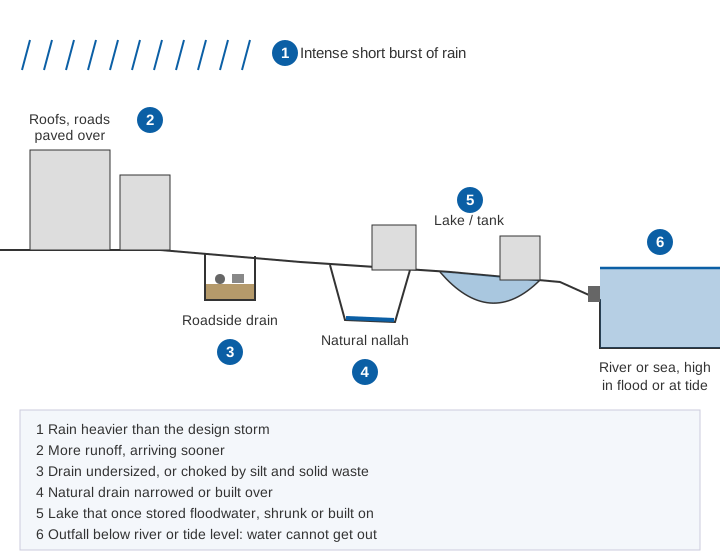
The causes of urban flooding in India are intense short bursts of rain falling on paved catchments, drains that were designed for small storms and are then choked by silt and waste, lakes and natural drains that have been built over, and outfalls that cannot discharge when the river or the sea is high. The CPHEEO manual and the NDMA guidelines list the same set [1][2].
Intense, short-duration rain
Many Indian cities receive most of their annual rain in the four monsoon months, and high-intensity rain, in the CPHEEO manual's words, is "responsible for frequent flooding" [2]. NDMA singles out thunderstorms, which give intensities "of the order of 50–70 mm/h", against which drains designed for much smaller values were overwhelmed in Delhi and other cities in 2009 and 2010 [1]. Rain can also vary sharply across one city: on 26 July 2005, Santacruz in Mumbai recorded 944 mm in 24 hours while Colaba, 22 km away, recorded 72 mm [1]. Gauge density is discussed in how many rain gauges does a district need.
Lost lakes and encroached natural drains
Streams and nallahs (natural drainage channels) carried a city's storm water, and lakes and tanks stored it. NDMA observes that the natural drains "should have been widened" as cities grew, but "on the contrary, there have been large scale encroachments on the natural drains and the river flood plains", reducing their capacity [1]. It also notes that urban water bodies have been dwindling, reclaimed and used for other purposes, sometimes by governments themselves [1].
Silted, choked and undersized drains
Many drains are too small for today's flows, and many more do not reach even their design capacity. The CPHEEO manual lists "illegal disposal of construction and demolition waste / municipal solid waste / plastic waste coupled with poor maintenance" among the main causes of local flooding, cites a 2011 ministry report that put storm drain coverage at about 20 % of the road network, and notes that many old city systems are combined sewers carrying sewage as well as storm water [2]. NDMA finds that pre-monsoon desilting "does not commence and get completed on time", so that "even lower intensity of rainfall results in flooding" [1].
Outfalls blocked by a high river or tide
In coastal cities, the CPHEEO manual notes that at high tide, discharge becomes a problem and sea water can flow back into the system [2]. NDMA recorded that only 3 of Mumbai's 105 outfalls had flood gates to keep the sea out [1]. Cities on rivers face the same problem when the river is in flood, and many have built in the river's floodplain [1].
What did Mumbai 2005 and Chennai 2015 teach?
Mumbai, July 2005. The 944 mm at Santacruz fell in 24 hours from 08:30 on 26 July, with 875 mm in the 12 hours from 14:30. At least 479 people died [1]. Over 100,000 residential and commercial establishments and 30,000 vehicles were damaged [7]. The city's century-old drainage network had been designed for 25 mm of rain per hour, and many drains were clogged. The Chitale Committee, set up to review the flooding, identified the overflow of the Mithi river and obstructions in its floodplain as the major man-made cause, and in 2010 NDMA reported that the city's storm drainage project was being redesigned for 50 mm/h [1].
Chennai, December 2015. The Comptroller and Auditor General's (CAG) performance audit found that the floods claimed 289 lives and inundated 23.25 lakh (2.3 million) houses [6]. Its principal findings read like a list of the causes above: "encroachment of tanks, lakes and river beds played a major role"; land-use conversions increased built-up area and reduced recharge; storm drain coverage was inadequate, with missing links and an incorrect design rainfall intensity; desilting in 2014 and 2015 had not begun before the monsoon; and the release from Chembarambakkam tank into the Adyar river, made without an emergency action plan or real-time inflow forecasting, was described as having "led to a man-made catastrophe" [6].
In both cities, extreme rain met a drainage chain weakened at several links.
What do the NDMA urban flooding guidelines recommend?
The NDMA guidelines of 2010 recommend treating the watershed as the basis for all urban flood management, and pairing better drains with real-time rainfall data and early warning [1]. Among the 23 key action points in its executive summary [1]:
- a local network of automatic rain gauges at a density of 1 per 4 km² in all Class I, II and III cities and towns, and Doppler weather radar coverage of urban areas;
- the catchment as the basis for storm drain design, with contour maps at 0.2–0.5 m intervals and an inventory of existing drains on GIS;
- a runoff coefficient of up to 0.95 for future drainage design, using the approved land-use plan;
- pre-monsoon desilting of drains completed before 31 March each year;
- rainwater harvesting in every building, protection and restoration of urban water bodies, and detention and retention facilities;
- removal of encroachments on drains and floodplains, with alternative housing for the poor, and better compliance with building rules;
- an urban flood early warning system, an incident response system and public awareness on solid waste and encroachments.
Urban flood management in India: what can planners do?
Urban flood management in India works best when it treats the whole drainage chain, from roof to outfall, rather than one drain at a time. Most of these measures are already in the manual and the guidelines.
- Plan by catchment and for the future. Delineate the watersheds of the city, use the runoff coefficient of the master-plan land use, and update the IDF curve as rainfall records grow [1][2].
- Slow the water down near where it falls. Rooftop harvesting, permeable paving, green roofs and bio-retention areas reduce and delay runoff. Detention ponds store the peak and release it slowly, typically limiting outflow to the pre-development rate [2]. China's Sponge City programme, launched in 2014, is a large-scale example: it uses soil and vegetation as part of runoff control, combines green and grey infrastructure, and selected 30 pilot cities in 2015 and 2016 [8].
- Restore lakes and natural drains. NDMA wants urban water bodies made "an integral part of the stormwater system" and restored by desilting [1].
- Keep drains at their design capacity. Desilt before the monsoon, keep solid waste out and inspect choke points; the worked example shows how much capacity silt removes. A checklist is in pre-monsoon readiness for flood warning systems.
- Protect the outfalls. Flap gates or non-return valves keep the sea or a high river out, and pumping stations lift water out when gravity cannot [2].
- Control building in floodplains and on drains. Land-use rules and building permissions decide where water will go for decades [1][6].
- Measure, then warn. Rain gauges show where the storm is; water-level sensors in drains, nallahs and underpasses show where the system is filling. A warning system turns both into timely action, as described in how a flood early warning system works.
Key points
- Paving raises the runoff coefficient and shortens the time of concentration: the same storm gives a peak 1.8 to 8 times higher, and sooner (NDMA).
- CPHEEO (2019) recommends a 5-year design storm in Class I cities, 2 years elsewhere and 50–100 years at critical infrastructure; many drains were built for 1–2 years.
- Peak flow follows the rational method, Q = C I A / 360; drains are sized with Manning's formula.
- The causes form a chain: intense rain, paved catchments, undersized and silted drains, lost lakes and nallahs, blocked outfalls.
- Mumbai 2005 and Chennai 2015 combined extreme rain with encroachment and poor drainage.
- NDMA (2010) asks for dense urban rain gauges, catchment-based design, desilting by 31 March and early warning.
Where ClimMaTech fits
At ClimMaTech we work on the measurement side of urban flooding: rainfall at the scale of a city's drainage catchments and water levels in the drains, nallahs and underpasses where floods begin. Our approach is described on the urban flooding page, and Tarang, our radar automatic water level recorder (AWLR), can be mounted above a drain or an underpass to record how fast the water rises.
References
- National Disaster Management Authority, National Disaster Management Guidelines: Management of Urban Flooding, NDMA, Government of India, New Delhi, September 2010. ndma.gov.in (PDF)
- Central Public Health and Environmental Engineering Organisation (CPHEEO), Manual on Storm Water Drainage Systems, Volume I, Part A: Engineering Design, Ministry of Housing and Urban Affairs, Government of India, 2019. web.archive.org copy of mohua.gov.in PDF (archived copy)
- L. B. Leopold, Hydrology for Urban Land Planning: A Guidebook on the Hydrologic Effects of Urban Land Use, Geological Survey Circular 554, US Geological Survey, 1968. doi:10.3133/cir554
- S. Barbhuiya, M. Ramadas, S. S. Biswal, Nonstationary Flood Frequency Analysis: Review of Methods and Models, in River, Sediment and Hydrological Extremes: Causes, Impacts and Management, Springer, 271–288, 2023. doi:10.1007/978-981-99-4811-6_15
- B. N. Goswami, V. Venugopal, D. Sengupta, M. S. Madhusoodanan, P. K. Xavier, Increasing trend of extreme rain events over India in a warming environment, Science 314(5804), 1442–1445, 2006. doi:10.1126/science.1132027
- Comptroller and Auditor General of India, Performance Audit of Flood Management and Response in Chennai and its Suburban Areas, Report No. 4 of 2017, Government of Tamil Nadu (tabled 2018). cag.gov.in
- K. Gupta, Urban flood resilience planning and management and lessons for the future: a case study of Mumbai, India, Urban Water Journal 4(3), 183–194, 2007. doi:10.1080/15730620701464141
- H. Jia, S. L. Yu, H. Qin, Low impact development and sponge city construction for urban stormwater management, Frontiers of Environmental Science & Engineering 11(4), 20, 2017. doi:10.1007/s11783-017-0989-4