
Are monsoon dry spells getting longer? 45 years of data
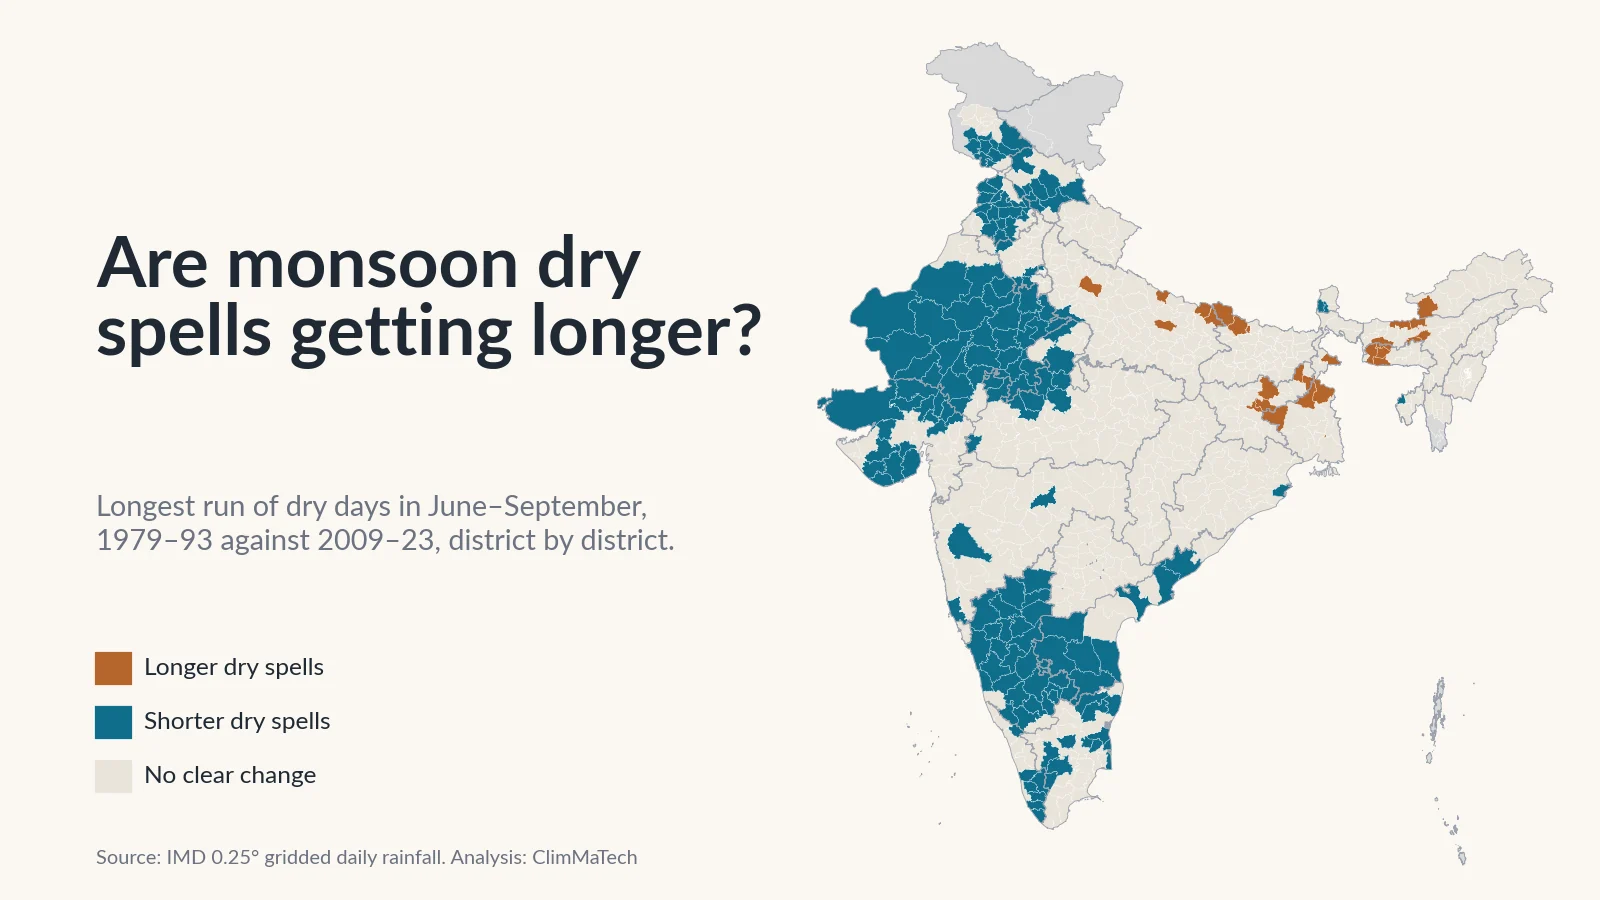
We measured the dry gaps inside every June–September from 1979 to 2023, district by district. Across most of India they have become shorter, not longer. The exception is a belt across the east and the Northeast, where rainy days have been lost and the gaps have grown.

Every monsoon has dry spells: runs of days in the middle of the season when the rain simply stops. A farmer who sowed after the first good showers watches the sky through them. A spell of a week is a nuisance. A spell of three weeks in July can cost a crop, even in a year that ends with "normal" rainfall.
A common belief is that these dry spells are getting longer. It fits a wider story about a monsoon that delivers its rain in fewer, bigger bursts with long gaps in between. Are monsoon dry spells actually getting longer? We tested it against 45 years of the India Meteorological Department's (IMD) daily rainfall data, for every district in the country.
The short answer is no, not for India as a whole. Across most of the country, the dry spells inside the monsoon have become a little shorter. In 160 districts they are clearly shorter than a generation ago. In 28 they are clearly longer, and those 28 sit almost entirely in one belt across Bihar, Jharkhand, West Bengal, eastern Uttar Pradesh and the Northeast.
This is the follow-up to our case study Is India's monsoon getting burstier?, which found that where rain has become more concentrated, the main reason is the loss of ordinary rainy days. Losing rainy days should, in principle, leave longer gaps. Here we measure the gaps directly.
How we looked
We used IMD's gridded daily rainfall dataset [1][2], the same record as in our earlier case studies. It turns readings from thousands of rain gauges into a regular grid of cells 0.25° (about 25 km) across, with one rainfall value per cell per day. We took every day from 1 June to 30 September in each year from 1979 to 2023: 122 days a season.
A dry day is a day with less than 2.5 mm of rain. That is the flip side of IMD's definition of a rainy day, which is a day with 2.5 mm or more [3]. A dry spell is a run of consecutive dry days. For every grid cell and every season we measured:
- Longest dry spell: the longest run of dry days in June–September.
- Long dry spells: the number of spells lasting 7 days or more, and separately 10 days or more.
- Days in long dry spells: the total number of days that fell inside spells of 7 days or more. This one measure combines how many long spells there were and how long they lasted.
- Dry days: all days with less than 2.5 mm, whether in long spells or short gaps.
A worked example shows how these fit together. Averaged over India, a place had about 77 dry days in a 122-day monsoon in 1979–93. About 46 of them fell inside 3.2 spells of a week or longer, and the longest spell of the season lasted about 20 days. The other 31 or so dry days were scattered in gaps of less than a week.
We compared the same two 15-year periods as in our earlier case studies, 1979–1993 and 2009–2023, and averaged every grid cell touching each district (2011 Census boundaries [4]). We called a district's change clear only if the difference between the two periods was at least twice its standard error, worked out from that district's own year-to-year swings. That is roughly a 5% test, so a few dozen districts would pass it by chance on any one measure. Formal trend tests over all 45 years are described in the Method section.
Two checks guard against obvious traps. The season's edges are one: in north-west India the monsoon often arrives in July and leaves in September, so the longest "dry spell" of June–September can be the wait for the monsoon, not a gap inside it. We therefore repeated every measure for July and August alone, the heart of the season. The other is the record itself. In a few hill and border areas the grid contains whole seasons, or long blocks of days, with exactly zero rain in otherwise wet places. Those are gaps in the gauge record, not droughts, and we left them out (details in the Method).
Are dry spells inside the monsoon getting longer?
Not on average. Every measure of long dry spells is slightly lower in 2009–23 than in 1979–93, and none of the changes is large compared with the year-to-year swings.
| June–September, average over India | 1979–93 | 2009–23 |
|---|---|---|
| Longest dry spell of the season | 19.8 days | 18.5 days |
| Dry spells of 7 days or more | 3.2 | 3.1 |
| Dry spells of 10 days or more | 2.0 | 1.8 |
| Days inside dry spells of 7 days or more | 46.0 | 42.1 |
| All dry days (under 2.5 mm) | 76.7 | 76.2 |
| June–September rainfall | 853 mm | 864 mm |
The longest dry spell at a typical place fell by about a day, from 19.8 to 18.5 days. The number of dry days hardly moved. None of these national series has a statistically significant trend over the 45 years in the Mann–Kendall test [5], with p-values between 0.09 and 0.73 against the usual 0.05 cut-off.
The national figures include the Thar desert and other dry regions, where most of the season is dry anyway. Leaving out every grid cell that averages less than 500 mm in June–September, which removes about 30% of India's area, the longest spell went from 15.0 to 13.6 days. That is a slightly larger fall, and it is also not significant (p = 0.06). Using a 1 mm threshold for a dry day instead of 2.5 mm gives the same picture: 16.5 days and then 15.2.
The year-to-year swings are much bigger than the change between periods. The longest dry spells came in 2002 (25.7 days at a typical place), 2001 (24.8) and 1979 (24.1). The shortest came in 2011 (14.7), 1983 (15.3) and 2020 (15.6). Across the 45 years, the longest dry spell and the season's rainfall have a correlation of −0.83. A dry monsoon is, above all, a monsoon with long breaks.
None of this makes dry spells rare. In both periods, about 90% of India's area averaged at least one dry spell of a week or more per season.
Where are monsoon dry spells getting longer?
District by district, the near-flat national line comes apart into two very unequal halves.
- 28 districts, home to about 5.7 crore (57 million) people, now have clearly longer dry spells.
- 160 districts, home to about 28.8 crore (288 million) people, now have clearly shorter ones.
- The remaining 495 districts show no clear change.
We call a district's dry spells "longer" if either its longest spell or its days in long spells rose clearly, and neither fell clearly. "Shorter" is the mirror image.
The map has a clear shape. Dry spells are shorter across the north-west (Rajasthan, Gujarat, Punjab, Haryana, Jammu and Kashmir and Himachal Pradesh) and across much of the south (Karnataka, Andhra Pradesh, Tamil Nadu and Kerala). They are longer in a belt from eastern Uttar Pradesh and northern Bihar through Jharkhand and West Bengal to Assam and the Garo Hills of Meghalaya. Central India, Maharashtra, Telangana, Chhattisgarh and Odisha are mostly unchanged.
The east: fewer rainy days, longer gaps
In the 28 districts where dry spells grew, the change is modest in absolute terms. Averaged over them, the longest spell of the season went from about 9 to 11.5 days, spells of a week or more from 1.6 to 2.2 a season, and the days spent inside such spells from about 16 to 22. These are still wetter places than the Indian average, and their gaps are still shorter than a typical place's. What changed is that they lost rain. June–September rainfall fell clearly in 17 of the 28, and the median fall across all 28 was 19%. Dry days rose clearly in 26 of them.
Kolkata is the clearest urban case. Its dry days in the monsoon rose from about 49 to 64. Spells of a week or more doubled, from about one a season to two. Spells of 10 days or more went from one every five years to almost one a year (0.2 to 0.9 a season). Across the border in Dakshin Dinajpur, the monsoon's rainfall fell from about 1,350 mm to 910 mm and the days in long spells rose from 15 to 27. Pashchim Champaran in north Bihar and Kushinagar and Mahrajganj in eastern Uttar Pradesh, all in the north of the Gangetic plain, each added about 11 days a season inside long dry spells.
This is the same belt where our burstiness analysis found rain becoming more concentrated. Of the 101 districts where rain became more concentrated, 17 now also have longer dry spells and only 2 shorter ones. Of the 135 districts where monsoon rainy days fell clearly, 26 have longer dry spells and 1 has shorter ones. Losing ordinary rainy days does lengthen the gaps, where it happens.
The Garo Hills are the exception again. There, monsoon rainfall rose (East Garo Hills went from about 2,310 mm to 3,130 mm) and yet the longest spell lengthened slightly, from under 5 days to about 6.5. The rain is arriving in fewer, bigger bursts. East, West, North and South Garo Hills and neighbouring Goalpara in Assam are the only districts where dry spells grew and heavy rain days also rose clearly in our heavy-rain analysis. Even so, a 6-day gap in a place that gets 3,000 mm in a monsoon is a different thing from a 6-day gap on a rainfed field in Bihar.
We are cautious about the Northeast. While checking this record we found two districts in southern Mizoram, Lawngtlai and Lunglei, where the grid shows a dry block of 30 to 70 days in every season up to 2006, and since 2007 mostly less than a week. That is a change in the gauges behind the grid, not in the rain, and we show both districts as having no reliable record. Elsewhere in the Northeast the signal is consistent across neighbouring districts, but the gauge network is sparse, and only a denser and stable network could confirm it.
The Gangetic plain: drier, but not through longer spells
Uttar Pradesh and Bihar show something subtler. Averaged over Uttar Pradesh's 75 districts, monsoon rainfall fell from about 830 mm to 690 mm between the two periods, and dry days rose from 80 to about 84 a season. Yet the days inside long dry spells barely moved (46.0 to 46.9), and only 5 districts have clearly longer spells. The extra dry days arrived as short gaps of a few days: the dry days outside long spells went from about 34 to 37. Bihar is similar. Its 38 districts lost about 175 mm of monsoon rain on average, but only 3 have clearly longer dry spells.
A season can become drier without its longest dry spell growing. For a farmer that is little comfort: many short gaps in a weaker monsoon still mean less water in the soil.
Where are dry spells getting shorter?
The larger half of the map is the opposite story, and it has had far less attention.
In Rajasthan, 29 of 33 districts now have shorter dry spells. The state's average longest spell fell from about 27 days to 23, and days in long spells from 72 to 60, as its monsoon rainfall rose from about 480 mm to 600 mm. In Karnataka, 27 of 30 districts have shorter spells; the state's longest spell fell from about 21 days to 16. Jaipur's longest dry spell shrank from about 27 days to 21, and Bengaluru's from 23 to 18. In Kerala's Kottayam it fell from 14 days to 8, while the monsoon's rainfall rose from about 1,510 mm to 2,000 mm.
The common thread is more rain. Of the 160 districts with shorter dry spells, monsoon rainfall rose clearly in 49 and fell clearly in none, with a median rise of 16%. Across all districts, the change in the longest dry spell and the percentage change in monsoon rainfall have a correlation of −0.70. More monsoon rain has mostly arrived as fewer and shorter gaps, which matches what our burstiness analysis found in the same regions. It found 90 districts where rain became more spread out over the year; of the 88 with a reliable dry-spell record, 70 now have shorter dry spells and none longer.
Two warnings apply to this half of the map. In Tamil Nadu and the southern tip of Andhra Pradesh, June–September is not the main rainy season; the north-east monsoon of October–December is. A long June–September dry spell there is normal and matters less. And in the north-west, part of the change sits at the edges of the season, in when the monsoon arrives and leaves. Our July–August check helps here. Of the 160 districts with shorter June–September spells, 67 also have clearly shorter spells in July–August alone and none have longer ones. Of the 28 with longer spells, 14 are also longer in July–August and none shorter. The direction holds in the core of the season; the edges make the June–September changes larger.
What the trend tests say
The district classification compares two blocks of 15 years. A stricter question is whether a steady trend runs through all 45 years, allowing for the fact that with hundreds of districts some will pass any test by chance. We applied the Mann–Kendall test [5] with Sen's slope [6] to every district, then the false discovery rate procedure recommended by Wilks [7].
- Longest dry spell: no district has a significant lengthening trend; 7 have a significant shortening one.
- Days in long dry spells: no district has a significant rise; 23 have a significant fall.
- Dry days: 76 districts have a significant rise and 37 a significant fall.
On the 25 km grid, the same procedure finds a significant lengthening of the longest dry spell over 0.5% of India's area and a significant shortening over 2.6%.
Where dry spells lengthened, the evidence comes from comparing the two periods; no district's 45-year record passes the strict trend test for longer spells.
How this fits with research on monsoon breaks
Meteorologists call the long dry spells of the core monsoon "breaks". Rajeevan, Gadgil and Bhate defined active and break spells from IMD's daily gridded data for 1951–2007, using rainfall over the core monsoon zone in July and August [8]. They found that breaks last longer than active spells: about 32% of break spells lasted a week or more. No break at all occurred in 26% of the years. And they found no significant trend in the number of break days. Our grid-cell measure is different, but it agrees: no national trend in long dry spells.
Singh and colleagues analysed observations over 1951–2011 and reported significant increases in the frequency of dry spells and decreases in their intensity during the South Asian monsoon, together with a decline in peak-season rainfall over the core monsoon region [9]. Our record starts in 1979 and covers all of India, and over that window long dry spells shrank slightly on average. The answer depends on period, region and definition.
Two cautions from our own work apply too. The station network behind IMD's grid changes over time. Lin and Huybers showed that changes in which stations report can shift the statistics of this dataset, with a jump towards more extreme rainfall in the mid-1970s [10]. We found similar gaps in the hills while checking this record. And future climate may not follow the recent past. In our study of CMIP6 climate model projections for India under a strong-mitigation scenario, the index of consecutive dry days increases by 25–75% over significant areas in both 2020–2049 and 2070–2099 [11]. The decades since 1979 are not a guarantee for the decades ahead.
Why do dry spells inside the monsoon matter?
Rainfed farming
About 51% of India's net sown area depends on rain for water, according to the Ministry of Agriculture and Farmers Welfare [12]. On that land, the gaps between rains matter as much as the season's total. Long breaks during critical growth stages substantially reduce crop yields [8]. An analysis of Indian daily rainfall and crop yields over 1970–2003 found that fewer rainy days have robust negative effects on yields, large enough to cancel the benefit of more total rain for most major crops [13].
An illustrative example shows why a week or ten days is the scale that matters. Suppose the root zone of a field holds 50 mm of water that the crop can draw easily, and the crop uses about 5 mm a day. FAO's typical values of reference evapotranspiration for humid and sub-humid tropics are 3–5 mm a day at moderate temperatures and 5–7 mm a day in warm conditions [14]. After 50 ÷ 5 = 10 dry days, the easy water is gone and the crop starts to suffer. In Kolkata district, spells of 10 days or more now come about 0.9 times a season instead of 0.2.
The season's total hides the gaps
A district's monsoon can be classified as normal by its total rain and still contain a three-week break at the wrong time. We explain how IMD classifies a season by its total in normal, excess, deficient: how IMD classifies monsoon rainfall. The total and the gaps are different questions, and both need to be measured.
What a 25 km grid can't see about a dry spell
Everything above is measured on a grid of 25 km cells. That is the best long record India has, but it has a blind spot that matters for dry spells.
A grid cell's value is an average over hundreds of square kilometres. A single storm that soaks a few villages can lift the cell average above 2.5 mm and "end" the dry spell for the whole cell, while most fields in it stay dry. Averaging also spreads a little rain over many days. Both effects mean that a farmer's field, or a single rain gauge, is likely to see longer dry spells than the grid. The dry spells that matter most are therefore local, and they are likely to be longer than any number in this article.
Soil moisture, which decides whether a crop survives a break, is even more local. It depends on the soil, the slope and the rain that fell on that field. Only measurements on the ground can follow it. How many rain gauges a district needs to see this kind of variation is the subject of our explainer how many rain gauges does a district need.
What would help
- Rain gauges at block and village level, reporting daily or better, so that a dry spell is measured where the crop is, not inferred from a 25 km average.
- Soil moisture measurements alongside the gauges in rainfed areas, because the same dry spell does very different damage on different soils.
- Dry spell monitoring during the season, district by district, so that agricultural advisories and contingency plans can respond in the second week of a break, not after the season ends.
- Denser and stable networks in the east and the Northeast, where dry spells have lengthened and where the record is least certain.
Key points
- Averaged over India, dry spells inside the monsoon have not become longer. The longest dry spell at a typical place was 19.8 days in 1979–93 and 18.5 days in 2009–23, and no national dry-spell measure has a significant trend over 1979–2023.
- Dry spells became clearly shorter in 160 districts (about 28.8 crore people), mainly in the north-west and the south, where the monsoon brought more rain.
- They became clearly longer in 28 districts (about 5.7 crore people), almost all in a belt from eastern Uttar Pradesh and Bihar through Jharkhand and West Bengal to Assam and the Garo Hills, where monsoon rainfall and rainy days fell.
- In Kolkata district, days inside dry spells of a week or more rose from about 8 to 19 a season.
- Uttar Pradesh and Bihar became drier mostly through more short gaps, not longer spells.
- No district passes a strict 45-year trend test for longer dry spells; the lengthening in the east shows up in the comparison of periods.
- A 25 km daily grid smooths out local dry spells, so village-level gauges and soil moisture measurements are needed to see them where crops grow.
At ClimMaTech we work on measuring rain where it falls. VARSHAQ, our weather station in development, is designed to record rainfall through the day at the places that need it, including the rainfed villages where a two-week break decides the harvest.
Method
Data: IMD 0.25° × 0.25° gridded daily rainfall [1][2], 1 June to 30 September of each year from 1979 to 2023 (45 seasons of 122 days). IMD provides the data for download, asks users to cite Pai et al. (2014) and states that it cannot guarantee the data are correct in all circumstances. The download page states no other licence terms [2].
Definitions: dry day, less than 2.5 mm (IMD's rainy day is 2.5 mm or more [3]); dry spell, a run of consecutive dry days. Spells are cut at 1 June and 30 September, so a spell that starts in May counts only its June days. Per grid cell and season we computed the longest dry spell, the number of spells of at least 7 and at least 10 days, the days inside spells of at least 7 days, the number of dry days and the total rainfall. We repeated the spell measures for July–August alone and, as a sensitivity check, with a 1 mm threshold.
Quality control: a cell-season was treated as missing if its June–September total was zero although the cell's median season brings at least 100 mm, or if it contained a dry spell of 60 days or more although the cell's median season brings at least 1,000 mm. This removed 499 cell-seasons in 135 cells, most of them in 1987, 1999, 2006–07 and 2011–12. Grid cells needed at least 40 usable seasons; 4,943 cells qualified.
National series: area-weighted average over all usable cells (cosine of latitude), so each value describes a typical place. As a check, we repeated it for the cells averaging at least 500 mm in June–September (about 70% of the area).
Periods: 1979–1993 and 2009–2023, 15 years each, as in our earlier case studies.
Districts: 2011 Census boundaries [4]. Each district's value is the mean over all grid cells touching the district. "Clear" change: the difference between the two period means is at least twice its standard error, from the district's own year-to-year values. "Longer dry spells": a clear rise in the longest spell or in the days inside spells of 7 days or more, with no clear fall in either; "shorter" is the reverse. We used the same 685 districts as our burstiness case study, minus Lawngtlai and Lunglei (Mizoram), which we show as no reliable record, leaving 683. Leh and Kargil (Ladakh) and the unnamed northern area of the 2011 boundary file are also shown as no reliable record, as in that study. Population figures are from the 2011 Census, and districts formed after 2011 are not counted in the population totals.
Trend tests: Mann–Kendall test [5] with tie correction and Sen's slope [6], on the national series, each grid cell and each district's seasonal series. We controlled the false discovery rate across cells or districts with the Benjamini–Hochberg procedure at 0.10, which approximates a 5% overall test for spatially correlated fields [7]. The tests do not correct for serial correlation.
Caveats: The station network behind the grid changes over time [1][10]. Gauges are sparse in the Northeast and the Himalaya. A daily, 25 km grid smooths out local rain and so shortens local dry spells. Comparing two 15-year periods does not separate long-term change from decadal variability. Maps are approximate and not to scale.
References
- Pai, D.S., Sridhar, L., Rajeevan, M., Sreejith, O.P., Satbhai, N.S. and Mukhopadhyay, B., Development of a new high spatial resolution (0.25° × 0.25°) long period (1901–2010) daily gridded rainfall data set over India and its comparison with existing data sets over the region, Mausam 65(1), 1–18, 2014. https://doi.org/10.54302/mausam.v65i1.851
- India Meteorological Department, Pune, High resolution (0.25 × 0.25 degree) gridded daily rainfall data (NetCDF), IMD. https://www.imdpune.gov.in/cmpg/Griddata/Rainfall_25_NetCDF.html
- India Meteorological Department, Northeast monsoon, Chapter 3: Mean rainfall distribution (rainy day: "a day with rainfall of 2.5 mm or more", p. 44), IMD, undated (uses data to 2021). https://mausam.imd.gov.in/responsive/pdf_viewer_css/met1/Chapter-3%20page%2037-51/Chapter-3%20.pdf
- Office of the Registrar General and Census Commissioner, India, Census of India 2011: census tables (Primary Census Abstract), Ministry of Home Affairs, 2011. https://censusindia.gov.in/census.website/data/census-tables
- Mann, H.B., Nonparametric tests against trend, Econometrica 13(3), 245–259, 1945. https://doi.org/10.2307/1907187
- Sen, P.K., Estimates of the regression coefficient based on Kendall's tau, Journal of the American Statistical Association 63(324), 1379–1389, 1968. https://doi.org/10.1080/01621459.1968.10480934
- Wilks, D.S., "The stippling shows statistically significant grid points": how research results are routinely overstated and overinterpreted, and what to do about it, Bulletin of the American Meteorological Society 97(12), 2263–2273, 2016. https://doi.org/10.1175/BAMS-D-15-00267.1
- Rajeevan, M., Gadgil, S. and Bhate, J., Active and break spells of the Indian summer monsoon, Journal of Earth System Science 119(3), 229–247, 2010. https://doi.org/10.1007/s12040-010-0019-4
- Singh, D., Tsiang, M., Rajaratnam, B. and Diffenbaugh, N.S., Observed changes in extreme wet and dry spells during the South Asian summer monsoon season, Nature Climate Change 4(6), 456–461, 2014. https://doi.org/10.1038/nclimate2208
- Lin, M. and Huybers, P., If rain falls in India and no one reports it, are historical trends in monsoon extremes biased?, Geophysical Research Letters 46(3), 1681–1689, 2019. https://doi.org/10.1029/2018GL079709
- Gupta, V., Singh, V. and Jain, M.K., Assessment of precipitation extremes in India during the 21st century under SSP1-1.9 mitigation scenarios of CMIP6 GCMs, Journal of Hydrology 590, 125422, 2020. https://doi.org/10.1016/j.jhydrol.2020.125422
- Ministry of Agriculture and Farmers Welfare, Economics and Statistics Division, Normal estimates of area, production and yield of selected principal crops (2017-18 to 2021-22), Government of India, May 2023 (note: "about 51% of the net area sown is dependent on rains for water"). https://desagri.gov.in/wp-content/uploads/2023/05/Normal-Estimates-2017-18-to-2021-22-2-1.pdf
- Fishman, R., More uneven distributions overturn benefits of higher precipitation for crop yields, Environmental Research Letters 11(2), 024004, 2016. https://doi.org/10.1088/1748-9326/11/2/024004
- Allen, R.G., Pereira, L.S., Raes, D. and Smith, M., Crop evapotranspiration: guidelines for computing crop water requirements, FAO Irrigation and Drainage Paper 56, FAO, Rome, 1998 (Chapter 1, Table 2). https://www.fao.org/4/x0490e/x0490e04.htm
Data credits: rainfall data from the India Meteorological Department; district boundaries and population from the Census of India 2011. Analysis, maps and charts: ClimMaTech.