
Is India's monsoon getting burstier? 45 years of data
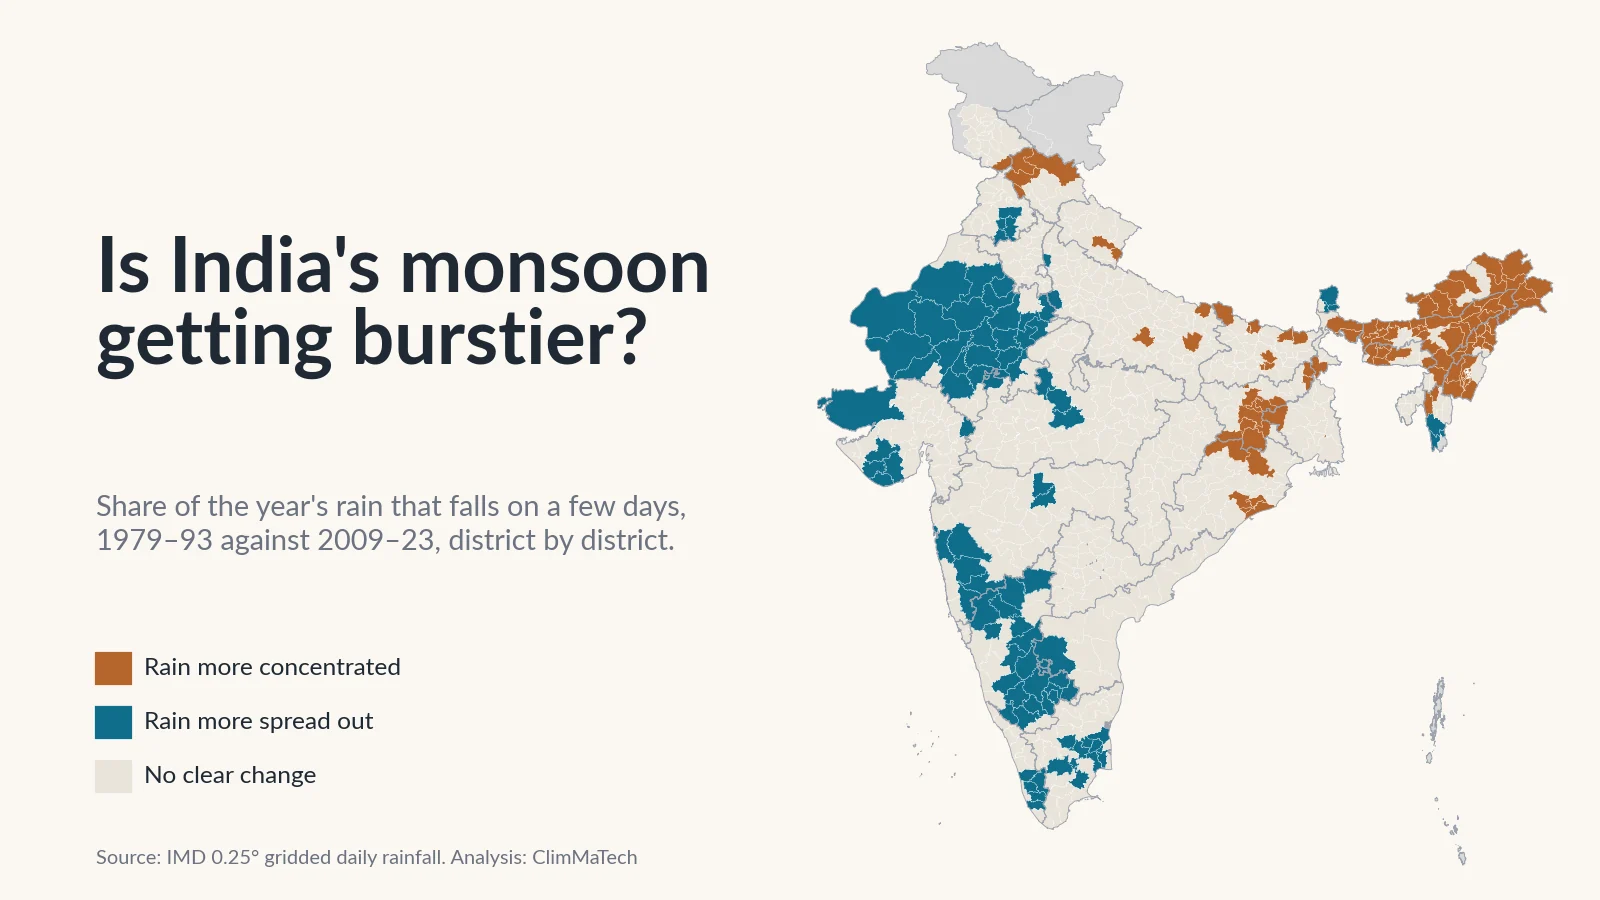
We measured how much of each year's rain falls on a handful of days, district by district, from 1979 to 2023. India as a whole has not shifted, but rain is concentrating in the Northeast and parts of the east, and spreading out across Rajasthan and the southern peninsula.

A common way to describe India's changing monsoon goes like this: the season's rain is about the same, but it now arrives in fewer, more violent bursts, with long dry gaps in between. It is a tidy story. It explains flooded underpasses in a month that ends with a rainfall deficit, and a crop that wilts in a "normal" monsoon.
Is India's monsoon actually getting burstier? We tested the claim against 45 years of the India Meteorological Department's (IMD) daily rainfall data. We asked a plain question of every place in the country: what share of the year's rain falls on just a few days, and has that share grown?
The short answer is no, not for India as a whole. The longer answer is more useful. In about 100 districts the year's rain has clearly become more concentrated, and in about 90 others it has clearly spread out over more days. Where it is concentrating, the main reason is not that the big days got bigger. It is that the ordinary rainy days became fewer.
This builds on our earlier case study, India's heavy rain isn't rising everywhere. It's moving, which counted heavy rain days. Counting heavy days and measuring concentration turn out to be different questions, with different maps.
How we looked
We used IMD's gridded daily rainfall dataset [1][2], the same record as in our earlier case study. It turns readings from thousands of rain gauges into a regular grid of cells 0.25° (about 25 km) across, with one rainfall value per cell per day. We used every day from 1 January 1979 to 31 December 2023.
For every grid cell and every calendar year, we sorted the 365 (or 366) daily totals from wettest to driest and measured four things:
- Share on the 5 wettest days: the percentage of the year's rain that fell on the year's five wettest days. We also did the same for the 10 wettest days, and for the wettest single day.
- Days for half the rain: the smallest number of days that together delivered half of the year's rain. Fewer days means more concentrated rain.
- Rainy days: days with 2.5 mm or more, the threshold IMD uses for a rainy day [3].
- Annual rainfall: the year's total.
We repeated the first three for the June–September monsoon season alone.
A worked example makes the first measure concrete. Averaged over India, a place received about 1,160 mm of rain a year in 1979–93, and 32.0% of it fell on its five wettest days. That is about 1,160 × 0.320 ≈ 371 mm, roughly a third of the year's rain in under 1.5% of its days.
We compared the same two 15-year periods as in our earlier case study, 1979–1993 and 2009–2023, and averaged every grid cell touching each district (2011 Census boundaries [4]). We called a district's change clear only if the difference between the two periods was at least twice its standard error, worked out from that district's own year-to-year swings. That is roughly a 5% test, so by chance alone a few dozen of India's districts would pass it on any one measure. We also ran formal trend tests over all 45 years, described in the Method section at the end.
Is India's rain falling on fewer days?
Hardly, and not in a way that makes the rain burstier. Averaged over the country, almost nothing moved between the two periods.
| Measure, average over India | 1979–93 | 2009–23 |
|---|---|---|
| Share of the year's rain on the 5 wettest days | 32.0% | 31.2% |
| Share on the 10 wettest days | 47.8% | 47.2% |
| Share on the single wettest day | 10.2% | 9.7% |
| Days that delivered half of the year's rain | 14.0 | 13.7 |
| Rainy days a year (2.5 mm or more) | 66.8 | 65.0 |
| Annual rainfall | 1,162 mm | 1,149 mm |
Two things stand out. First, Indian rain is already very concentrated. At a typical place, half of the year's rain arrives in about 14 days, out of roughly 66 rainy days. Second, that has not changed in a measurable way. The share on the five wettest days slipped by less than one percentage point. The monsoon season on its own tells the same story: the share of June–September rain on the season's five wettest days went from 39.1% to 37.9%, and half of the season's rain arrived in about 10 days in both periods.
We also tested for a steady trend across all 45 years, using the Mann–Kendall test [5] and Sen's slope [6]. None of the national series in the chart has a statistically significant trend: the p-values range from 0.34 to 0.99, far from the usual 0.05 cut-off.
The year-to-year swings are larger than the change between periods, and they carry a warning about how to read this kind of number. The most concentrated year in the record was 2002, a drought year, when the five wettest days carried 38.2% of a typical place's rain. The least concentrated was 1983, at 27.7%. Across the 45 years, the share on the five wettest days and the year's total rainfall have a correlation of −0.79. In a dry year the ordinary rainy days fail, and the few big days that still come make up a larger share of a smaller total. A rising share can therefore mean that big days are getting bigger, or simply that everything else is getting smaller. Keep that in mind for the map.
Where is rain becoming more concentrated?
District by district, the flat national line again comes apart, as it did for heavy rain days.
- 101 districts, home to about 10.7 crore (107 million) people, now get their year's rain in a clearly more concentrated way.
- 90 districts, home to about 19.4 crore (194 million) people, get it in a clearly more spread-out way.
- The remaining 494 districts show no clear change.
We call a district "more concentrated" if either the share on the five wettest days rose clearly or the days delivering half the rain fell clearly, and neither measure pointed the other way. "More spread out" is the mirror image.
The pattern is not random. Concentration is rising in a block across the Northeast and in an arc through Jharkhand, Bihar, West Bengal and coastal Odisha. Rain is spreading out across western Rajasthan and Saurashtra, much of Karnataka, inland Maharashtra, Tamil Nadu and central Kerala. The Gangetic plain, central India and the Deccan are mostly unchanged.
The Northeast: fewer rainy days, same big days
The Northeast is still the least concentrated part of India. Its rain is spread over so many days that the five wettest carry only about 14–20% of the year's total, against about 31% for a typical place in India. But it is the region where concentration has risen most widely. Of the 89 districts in Assam, Arunachal Pradesh, Nagaland, Manipur, Meghalaya, Mizoram and Tripura, 61 became clearly more concentrated and only 2, both in Mizoram, became more spread out. They include 21 of Assam's 27 districts, 14 of Arunachal Pradesh's 16 and 10 of Nagaland's 11.
Averaged over those 89 districts:
- Rainy days fell from about 138 to 121 a year.
- Annual rainfall fell from about 2,530 mm to 2,240 mm.
- The days delivering half of the year's rain fell from 29 to 25.5.
- The share on the five wettest days rose from 15.9% to 17.3%.
So most of the change is the loss of about 18 ordinary rainy days a year, not bigger downpours.
The Garo Hills of western Meghalaya are the exception. There, the year's total went up as well: East Garo Hills went from about 3,310 mm to 4,450 mm, and West Garo Hills from about 2,560 mm to 3,210 mm. Days delivering half the rain fell from about 31 to 22 in East Garo Hills and from 30 to 21 in South Garo Hills. These are the same districts where our earlier case study found the largest rise in heavy rain days in India. West, East and North Garo Hills are the only three districts in the country where rain became clearly more concentrated while the year's total also clearly rose. Here the bursts really have grown.
Dhubri in lower Assam got burstier without losing rain: its annual total stayed close to 2,900–3,000 mm while the days delivering half of it fell from 24 to 20.
We are cautious about the Northeast. Rain gauges are sparse in its hills, and gridded values there lean heavily on interpolation. A study of this same IMD dataset has shown that changes in which stations report can shift its rainfall statistics. It found a jump towards more extreme rainfall in the mid-1970s, before our record begins [7]. A fall in the number of reporting gauges would make ordinary rainy days look fewer. We cannot rule that out here. The signal is consistent across dozens of neighbouring districts, but only a denser and stable gauge network could confirm it.
Jharkhand, Bihar, West Bengal and Odisha
The second cluster runs from the Chota Nagpur plateau to the Bay of Bengal. Eleven of Jharkhand's 24 districts became more concentrated, along with 8 of Bihar's 38, 5 in West Bengal and 5 in Odisha.
The mechanism is mostly the same as in the Northeast. Across Jharkhand's districts, rainy days fell from about 82 to 76 a year and annual rainfall from about 1,270 mm to 1,170 mm, while the days delivering half the rain fell from 17.5 to 15.9. In Kolkata, rainy days fell from about 102 to 81 a year, and half of the year's rain now arrives in about 16.5 days instead of 20. Bokaro went from 19 days to 15.
Puri on the Odisha coast is different. Its rain did not fall: it was about 1,460 mm a year in the early period and 1,500 mm in the recent one. Yet half of it now arrives in about 12.7 days instead of 15.5, and the share on the five wettest days rose from 26.0% to 29.4%. The same total, delivered in fewer, bigger days, is the pattern the common claim describes. On this record it is the exception, not the rule.
In Himachal Pradesh, 4 of 12 districts became more concentrated, Kangra among them. There too, rainy days fell (from about 94 to 85) along with the year's total.
Where is rain spreading out?
The other half of the map gets less attention, but it is just as large and home to more people.
Rajasthan and Gujarat
The desert is where Indian rain is most concentrated, and where that has eased most. In 1979–93, Jaisalmer received about two-thirds of its year's rain (68.2%) on five days. In 2009–23 the figure was 57.1%. Its rainy days went from about 12 to 18 a year and its rainfall from about 160 mm to 250 mm. Across Rajasthan's 33 districts, 23 became more spread out and none more concentrated. Rainy days rose from about 32 to 38 a year and annual rainfall from about 540 mm to 660 mm.
Six Gujarat districts, Rajkot and Junagadh among them, follow the same pattern. Western India has become wetter, and that has come as more rainy days, not just bigger storms.
The southern peninsula
In Karnataka, 20 of 30 districts became more spread out, as did 9 districts each in Maharashtra and Tamil Nadu and 5 in Kerala. Across Karnataka, rainy days rose from about 63 to 72 a year and annual rainfall from about 1,085 mm to 1,215 mm. In Bengaluru district, half the year's rain used to arrive in about 12 days and now takes about 14, with rainy days up from 54 to 67. In Kerala's Kottayam it went from about 27 days to 31, with the year's total up from about 2,280 mm to 3,180 mm.
More heavy rain is not the same as burstier rain
This is where the two case studies meet. Mumbai is one of the places where our heavy-rain analysis found the clearest rise: about 11 heavy rain days (64.5 mm or more) a year in 1979–93 against 13 in 2009–23. On the concentration measures, though, Mumbai became more spread out. The share of its rain on the five wettest days fell from 29.9% to 26.0%, and rainy days rose from about 83 to 92 a year. Pune shows the same thing. The year got wetter on many days at once, heavy ones included, so the heavy days are more frequent but carry a slightly smaller share of the total.
The same holds across the country. Of the 120 districts where heavy rain days clearly rose in our earlier analysis, only 21 became clearly more concentrated, 16 became more spread out, and the rest show no clear change. Across all districts, the change in the five-day share and the percentage change in annual rainfall have a correlation of −0.60. More rain has mostly meant more spread-out rain, and less rain more concentrated rain.
What the trend tests say
The district classification compares two blocks of 15 years. A stricter question is whether a steady trend runs through all 45 years, after allowing for the fact that with hundreds of districts some will pass any test by chance. We applied the Mann–Kendall test to every district and then the false discovery rate procedure recommended by Wilks [8], which controls how many of the declared trends are expected to be false.
- Share on the five wettest days: only 3 districts have a significant rising trend and 2 a falling one. On this measure there is almost no district-level trend that survives the correction.
- Days for half the rain: 38 districts have a significant fall (more concentrated) and 18 a significant rise.
- Rainy days: 91 districts have a significant fall and 51 a significant rise.
On a 25 km grid, the same procedure finds a significant rise in the five-day share over 5.5% of India's area and a significant fall over 5.0%.
The most robust signal in this record is not bigger bursts. It is a loss of rainy days in some regions and a gain in others. Where rainy days are lost, the rain that remains becomes more concentrated.
How this fits with research on Indian rainfall
Our result sits comfortably with the published research once the measures are kept apart. Goswami and colleagues found rising trends in the frequency and magnitude of extreme rain events over central India in the monsoon seasons of 1951–2000, and a falling trend in moderate events. The seasonal mean showed no significant trend, because the two offset each other [9]. Roxy and colleagues reported a threefold rise in widespread extreme rain events over central India during 1950–2015, alongside a decline in total rainfall [10].
Those studies count extreme events. Our measures ask what share of the year those events carry. In central India we find little change in that share: none of Madhya Pradesh's 50 districts or Chhattisgarh's 27 became clearly more concentrated. Ghosh and colleagues found no spatially uniform changes in heavy rainfall over India in the second half of the twentieth century, but an increase in spatial variability [11]. That is the pattern our map shows for concentration too. Singh and colleagues found increases in daily rainfall variability, in the frequency of dry spells and in the intensity of wet spells during the South Asian monsoon over 1951–2011 [12].
Two warnings apply to all of this work, ours included. Lin and Huybers showed that changes in the network of stations feeding IMD's gridded data introduce a jump towards more extreme rainfall after 1975. Trends measured across that jump are suspect, and those measured after it were not significant in their analysis [7]. Our record starts in 1979, but the number of gauges reporting each day still varies [1]. Second, when we compared satellite rainfall products with this IMD dataset, their ability to capture extremes varied strongly from region to region [13]. Any single gridded dataset gives one view of the rain, not the last word.
Why does it matter whether rain comes in bursts?
Drains and urban flooding
City drains do not care about the annual total. They care about how much rain falls in an hour. India's national guidelines on urban flooding note that storm drains were traditionally designed for rainfall intensities of 12–20 mm an hour, and that short, intense thunderstorm rain overwhelms such systems [14]. A district where half the year's rain arrives in 16 days instead of 20 is asking its drains to carry more water on each of those days. We explain how this plays out in a city in why cities flood.
Reservoirs
A reservoir operator in the Northeast or Jharkhand is working with fewer rainy days to fill the reservoir and more of the inflow arriving in a few spells. That narrows the margin between storing water for the dry season and keeping space for the next flood. It makes inflow forecasting from rain measured upstream, rather than from the season's average, more valuable.
Agriculture
For a farmer, fewer rainy days usually means longer gaps between them. Dry spells inside the monsoon are a separate question from concentration, and we have not analysed them here. Where rainy days are falling, though, the gaps between them are worth watching.
Landslides
Slopes respond both to intense bursts and to rain that builds up over days. A rainfall-threshold study around Chamoli and Joshimath in the Garhwal Himalaya related landslides both to the intensity and duration of rain events and to the rain that came before: a minimum of 55 mm over the previous 10 days and 185 mm over the previous 20 days was needed to start them [15]. In our analysis of the July 2023 floods in Himachal Pradesh, extremely heavy rain falling on near-saturated soil, with snowmelt, drove the flood peak [16]. Concentration alone does not set landslide risk. What matters is the burst and the wetness that came before it, and both have to be measured locally.
Why a daily grid can't see a cloudburst
Everything above is measured in whole days on a 25 km grid. That is the best long record India has, but it has two blind spots, and both matter most for bursts.
First, a day is too long. A 60 mm day might be ten hours of steady rain or a single hour of downpour. To a farmer the two are similar. To a city drain they are completely different. The daily data cannot tell them apart. The bursts that flood streets last minutes to hours, and only gauges that record through the day can see them. How to turn those records into design rainfall is the subject of our explainer on intensity–duration–frequency curves.
Second, a grid cell is too big. A storm that soaks one village and misses the next shows up as a modest wet day across a whole 25 km cell. Averaging over the cell spreads rain out, so a single rain gauge will usually see its year's rain arrive in even fewer days than the grid suggests. How many gauges a district needs to see that is a question we look at in how many rain gauges does a district need.
Put together, this means the concentration of rain where people live is higher than any number in this article. And the change in it is something the existing grid can only partly see.
What would help
- Rain gauges that record through the day, reporting in real time, so that districts know their real hourly bursts rather than daily totals.
- Denser and stable networks in the Northeast and the hills, where our results are most striking and least certain. A gauge that keeps reporting for decades is worth more for detecting change than a new one every few years.
- Drainage and culvert design from local short-duration rainfall, updated as the record grows, rather than from regional or decades-old figures.
- Warnings that reach people within the burst, because a burst gives little time between the first heavy rain and water in the street.
Key points
- Averaged over India, the year's rain is no more concentrated than a generation ago. The five wettest days carried 32.0% of a typical place's rain in 1979–93 and 31.2% in 2009–23. Half of the year's rain arrived in about 14 days in both periods.
- No national concentration measure has a significant trend over 1979–2023.
- District by district, rain became clearly more concentrated in 101 districts (about 10.7 crore people) and clearly more spread out in 90 (about 19.4 crore). 494 show no clear change.
- Concentration is rising mainly in the Northeast, Jharkhand, Bihar, West Bengal and coastal Odisha, mostly because ordinary rainy days became fewer, not because big days grew. The Garo Hills are the exception, with more rain arriving in bigger bursts.
- Rain is spreading out across Rajasthan, Karnataka, parts of Maharashtra, Tamil Nadu, Gujarat and Kerala, where years became wetter on more days.
- More heavy rain days does not mean burstier rain: Mumbai has more heavy days and less concentrated rain.
- Daily, 25 km data miss the hourly, local bursts that flood streets, so local recording gauges are needed to see them.
At ClimMaTech we work on measuring rain and water where they matter. VARSHAQ, our weather station in development, will record rainfall where it falls through the day. Tarang, a radar automatic water level recorder (AWLR), tracks how fast streams and drains rise. RAKSHAK is a multi-hazard warning siren with 15–20 user-selectable siren tones and voice messages. It carries flood alerts, warnings of other disasters and civil-defence signals to the people who need them.
Method
Data: IMD 0.25° × 0.25° gridded daily rainfall [1][2], 1 January 1979 to 31 December 2023 (16,436 days). IMD provides the data for download, asks users to cite Pai et al. (2014) and states that it cannot guarantee the data are correct in all circumstances. The download page states no other licence terms [2].
Grid cells: 4,964 cells with a complete record in at least 40 of the 45 years. A cell-year with any missing day was left out; this affected 79 cells along the Saurashtra and Kutch coast in 2023. In a year with no rain at all, which happens in the driest desert and mountain cells, the shares and the days for half the rain are undefined and that year was skipped for that cell.
Measures, per grid cell and calendar year (and separately for June–September): the share of the period's rain on the 1, 5 and 10 wettest days; the smallest number of days whose rain adds up to half of the period's total; the number of rainy days (2.5 mm or more [3]); and the total. We did not use Oliver's precipitation concentration index, which measures how rain is spread across the twelve months [17], because the monsoon dominates that measure across most of India. Nor did we use Martín-Vide's daily concentration index, which fits a curve to the cumulative contribution of the rainiest days [18]. The share on the wettest days and the days for half the rain express the same idea in plain units.
National series: area-weighted average over all valid cells (cosine of latitude), so each value describes a typical place, not India's total rain. Two checks gave the same result. Leaving out cells with less than 500 mm a year, the five-day share was 29.2% in 1979–93 and 29.1% in 2009–23. Weighting by rain rather than area, the share of all India's rain falling on each cell's five wettest days was 26.2% and 26.3%.
Periods: 1979–1993 and 2009–2023, 15 years each, as in our earlier case study.
Districts: 2011 Census boundaries [4]. Each district's value is the mean over all grid cells touching the district. "Clear" change: the difference between the two period means is at least twice its standard error, from the district's own year-to-year values. "More concentrated": a clear rise in the five-day share or a clear fall in days for half the rain, with no clear change the other way on either measure; "more spread out" is the reverse. 685 districts have a usable record (at least 100 mm a year in 1979–93, as in our earlier case study; Saiha in Mizoram has no early record). Leh and Kargil (Ladakh) and the unnamed northern area of the 2011 boundary file are shown as having no reliable record: the grid there rests on very few gauges, and Leh's average annual total, for example, falls from about 940 mm in 1979–93 to about 320 mm in 2009–23. Population figures are from the 2011 Census, and districts formed after 2011 are not counted in the population totals.
Trend tests: Mann–Kendall test [5] with tie correction and Sen's slope [6], on the national series, each grid cell and each district's annual series. We controlled the false discovery rate across cells or districts with the Benjamini–Hochberg procedure at 0.10, which approximates a 5% overall test for spatially correlated fields [8]. The tests do not correct for serial correlation.
Caveats: The station network behind the grid changes over time, which can affect rainfall statistics [1][7]. Gauges are sparse in the Northeast and the Himalaya. A daily, 25 km grid smooths out short and local bursts. Comparing two 15-year periods does not separate long-term change from decadal variability. Maps are approximate and not to scale.
References
- Pai, D.S., Sridhar, L., Rajeevan, M., Sreejith, O.P., Satbhai, N.S. and Mukhopadhyay, B., Development of a new high spatial resolution (0.25° × 0.25°) long period (1901–2010) daily gridded rainfall data set over India and its comparison with existing data sets over the region, Mausam 65(1), 1–18, 2014. https://doi.org/10.54302/mausam.v65i1.851
- India Meteorological Department, Pune, High resolution (0.25 × 0.25 degree) gridded daily rainfall data (NetCDF), IMD. https://www.imdpune.gov.in/cmpg/Griddata/Rainfall_25_NetCDF.html
- India Meteorological Department, Northeast monsoon, Chapter 3: Mean rainfall distribution (rainy day: "a day with rainfall of 2.5 mm or more", p. 44), IMD, undated (uses data to 2021). https://mausam.imd.gov.in/responsive/pdf_viewer_css/met1/Chapter-3%20page%2037-51/Chapter-3%20.pdf
- Office of the Registrar General and Census Commissioner, India, Census of India 2011: census tables (Primary Census Abstract), Ministry of Home Affairs, 2011. https://censusindia.gov.in/census.website/data/census-tables
- Mann, H.B., Nonparametric tests against trend, Econometrica 13(3), 245–259, 1945. https://doi.org/10.2307/1907187
- Sen, P.K., Estimates of the regression coefficient based on Kendall's tau, Journal of the American Statistical Association 63(324), 1379–1389, 1968. https://doi.org/10.1080/01621459.1968.10480934
- Lin, M. and Huybers, P., If rain falls in India and no one reports it, are historical trends in monsoon extremes biased?, Geophysical Research Letters 46(3), 1681–1689, 2019. https://doi.org/10.1029/2018GL079709
- Wilks, D.S., "The stippling shows statistically significant grid points": how research results are routinely overstated and overinterpreted, and what to do about it, Bulletin of the American Meteorological Society 97(12), 2263–2273, 2016. https://doi.org/10.1175/BAMS-D-15-00267.1
- Goswami, B.N., Venugopal, V., Sengupta, D., Madhusoodanan, M.S. and Xavier, P.K., Increasing trend of extreme rain events over India in a warming environment, Science 314(5804), 1442–1445, 2006. https://doi.org/10.1126/science.1132027
- Roxy, M.K., Ghosh, S., Pathak, A., Athulya, R., Mujumdar, M., Murtugudde, R., Terray, P. and Rajeevan, M., A threefold rise in widespread extreme rain events over central India, Nature Communications 8, 708, 2017. https://doi.org/10.1038/s41467-017-00744-9
- Ghosh, S., Das, D., Kao, S.-C. and Ganguly, A.R., Lack of uniform trends but increasing spatial variability in observed Indian rainfall extremes, Nature Climate Change 2(2), 86–91, 2012. https://doi.org/10.1038/nclimate1327
- Singh, D., Tsiang, M., Rajaratnam, B. and Diffenbaugh, N.S., Observed changes in extreme wet and dry spells during the South Asian summer monsoon season, Nature Climate Change 4(6), 456–461, 2014. https://doi.org/10.1038/nclimate2208
- Gupta, V., Jain, M.K., Singh, P.K. and Singh, V., An assessment of global satellite-based precipitation datasets in capturing precipitation extremes: a comparison with observed precipitation dataset in India, International Journal of Climatology 40(8), 3667–3688, 2020. https://doi.org/10.1002/joc.6419
- National Disaster Management Authority, National Disaster Management Guidelines: Management of Urban Flooding, NDMA, Government of India, 2010. https://ndma.gov.in/sites/default/files/PDF/Guidelines/management_urban_flooding.pdf
- Kanungo, D.P. and Sharma, S., Rainfall thresholds for prediction of shallow landslides around Chamoli-Joshimath region, Garhwal Himalayas, India, Landslides 11(4), 629–638, 2014. https://doi.org/10.1007/s10346-013-0438-9
- Gupta, V., Syed, B., Pathania, A., Raaj, S., Nanda, A., Awasthi, S. and Shukla, D.P., Hydrometeorological analysis of July-2023 floods in Himachal Pradesh, India, Natural Hazards 120(8), 7549–7574, 2024. https://doi.org/10.1007/s11069-024-06520-5
- Oliver, J.E., Monthly precipitation distribution: a comparative index, The Professional Geographer 32(3), 300–309, 1980. https://doi.org/10.1111/j.0033-0124.1980.00300.x
- Martín-Vide, J., Spatial distribution of a daily precipitation concentration index in peninsular Spain, International Journal of Climatology 24(8), 959–971, 2004. https://doi.org/10.1002/joc.1030
Data credits: rainfall data from the India Meteorological Department; district boundaries and population from the Census of India 2011. Analysis, maps and charts: ClimMaTech.