
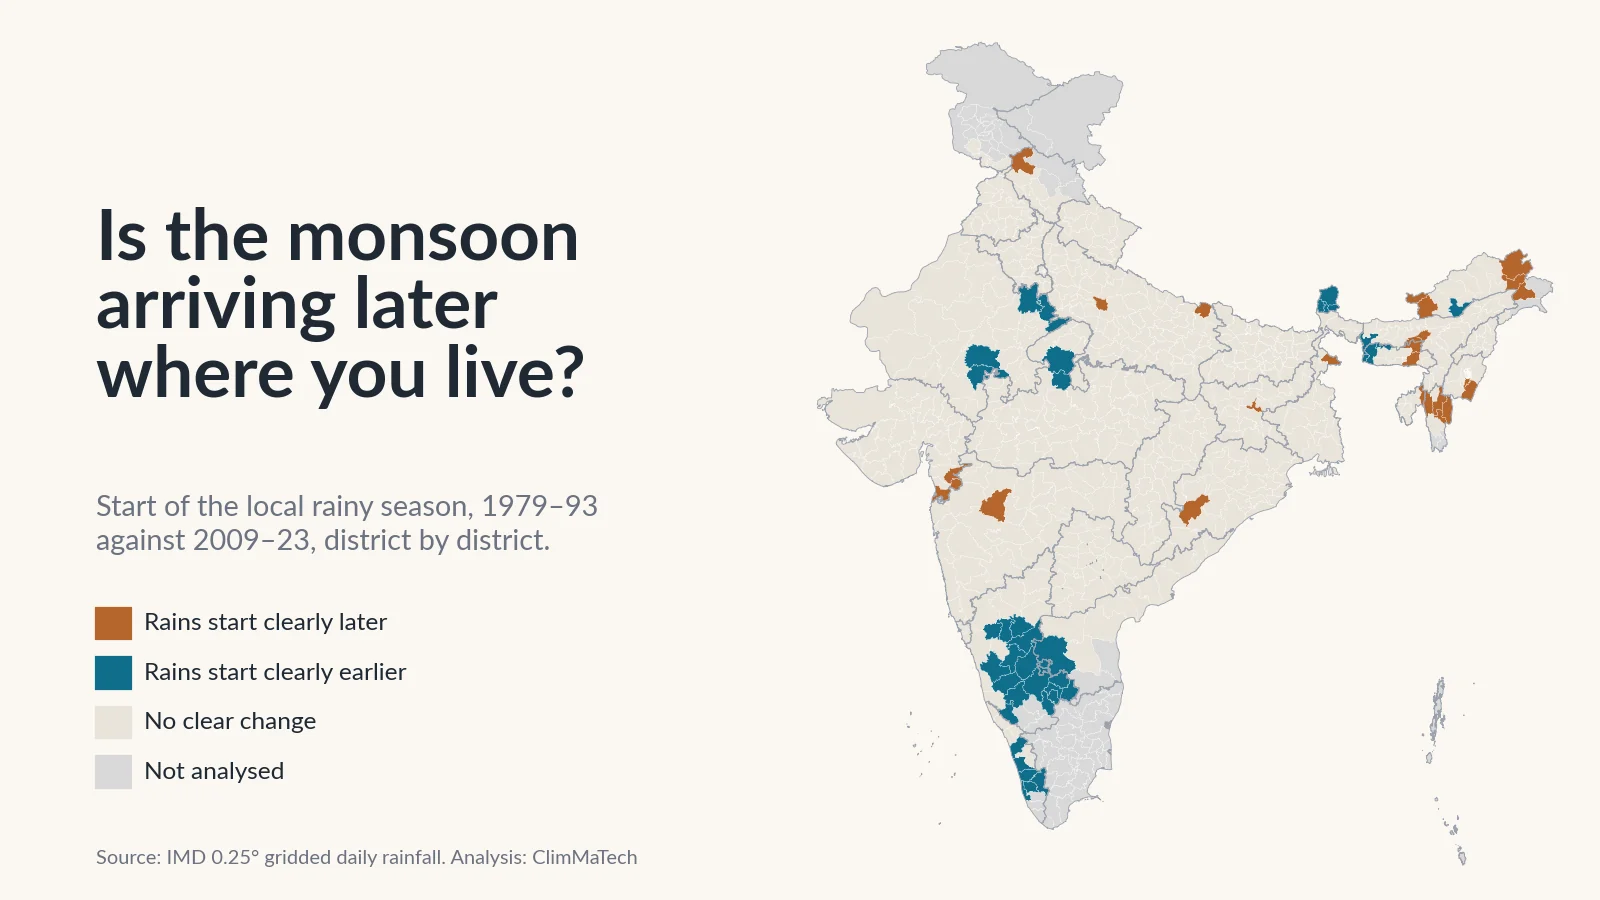
Is the monsoon arriving later where you live?
We dated the start and end of the rainy season in every district from 45 years of IMD rainfall. Kerala's official onset has not moved, and in most districts the rains start when they used to. What has changed is how long they last.

Every year, one date makes the news before the rain reaches most of India: the day the India Meteorological Department (IMD) declares that the southwest monsoon has set in over Kerala. In 2023 it came on 8 June, a week after the normal date of 1 June. In 2025 it came on 24 May, the earliest since 2009 [1]. A late date sets off talk of a delayed monsoon. An early one raises hopes of an early sowing season.
But nobody sows a crop in Kerala's statistics. A farmer in Vidarbha, a reservoir operator in Gujarat or a disaster officer in Assam needs to know when the rains will start where they are. So is the monsoon arriving later where you live?
We tested that question against 45 years of IMD's daily rainfall data, district by district. The short answer is no, not for most of India. Kerala's onset date has not shifted, and in about nine districts out of ten the local rainy season starts when it did a generation ago. There are exceptions. The rains now start later in parts of the Northeast and earlier across southern Karnataka. The clearer change is at the other end of the season: across the northwest, west and centre of the country, the rains last longer into September.
This is the next step from our earlier case studies on heavy rain and on how concentrated the monsoon has become. Those asked how much rain falls and how it falls. This one asks when.
How we looked
We used IMD's gridded daily rainfall dataset [2][3], the same record as in our earlier case studies. It turns readings from thousands of rain gauges into a grid of cells 0.25° (about 25 km) across, with one rainfall value per cell per day. We used every day from 1 January 1979 to 31 December 2023.
There is no single rainfall definition of "monsoon onset". We used two published ones, because they answer slightly different questions.
Start and end of the rainy season. Keep a running total of each day's rain minus the place's average daily rain over the whole year. In the dry months this total falls, because every day is drier than average. Once the rains set in, it climbs. The rainy season starts the day after the lowest point of the curve and ends on its highest point. This is the "anomalous accumulation" method used for rainy seasons in South America [4]. Misra and colleagues used a version of it to date local onset and demise on this same IMD grid [5]. It gives a start and an end every year, so it also gives the length of the season.
Safe-sowing start. Moron and Robertson proposed an agronomic definition for India: the first significant rains that are not followed by a dry spell long enough to threaten a newly sown crop [6]. In the form set out in a recent preprint [7], it is the first day after 1 April that begins a five-day wet spell (at least 1 mm on that day, and a five-day total at least equal to the place's usual five-day monsoon rainfall) that is not followed by a 10-day spell with less than 5 mm in the next 30 days. A wet spell that is followed by such a dry spell is a false start.
For Nagpur, for example, the five-day amount is about 40 mm. The safe-sowing start there is the first day of a five-day spell with at least 40 mm, with no 10 dry days in the month that follows.
We worked these out for every grid cell and every year, then averaged the cells in each district (2011 Census boundaries [8]). We compared the same two 15-year periods as in our earlier case studies, 1979–1993 and 2009–2023. We called a change clear only if the difference between the two periods was at least twice its standard error, worked out from that district's own year-to-year swings. That is roughly a 5% test, so by chance alone a few dozen of India's 600-odd districts would pass it. We also ran formal trend tests over all 45 years, described in the Method section.
One limit applies to both definitions. Where most of the year's rain falls outside June–September, as in Tamil Nadu and most of Jammu and Kashmir, a summer rainy-season start means something different, so we left those districts out. That leaves 621 districts with a usable record.
Is the monsoon arriving later over Kerala?
No. IMD's declared onset over Kerala averaged 1 June in 1979–1993 and 2 June in 2009–2023 [9][10][1]. A Mann–Kendall trend test [11] over the 45 years finds no trend (p = 0.75). Onsets on or after 8 June, a week or more late, happened twice in the first period and three times in the second. That is about what you would expect from a date that IMD says varies by about seven days from year to year [12].
The rainy-season start averaged over India's monsoon area tells the same story. In 2009–2023 the rains started on average about 2 days earlier than in 1979–1993, and this is neither a clear change nor a significant trend (p = 0.11). The share of India where the rains started more than two weeks late fell slightly, from 21% of the monsoon area in a typical year of the first period to 18% in the second.
What IMD's onset date is, and what it is not
The Kerala date is not a rainfall average. Since 2006, IMD declares onset when, after 10 May, at least 60% of 14 listed stations in Kerala, Lakshadweep and coastal Karnataka report 2.5 mm or more of rain on two consecutive days. This must come with a deep westerly wind flow, up to the 600 hPa level, over the Arabian Sea south of 10°N, winds of about 15–20 knots at the 925 hPa level, and thick cloud: outgoing longwave radiation below 200 W/m² off the Kerala coast [9]. Before 2006, IMD used rainfall at seven stations alone [13].
So the declared date marks the arrival of the large-scale monsoon circulation at India's southwest tip. The criteria matter. Under the older rules, the 2004 onset was declared on 18 May. Reworked under the 2006 criteria, it falls on 3 June [9]. Across 1979–2005, the reworked dates differ from the declared ones by about 3 days on average. With either set of dates, there is no trend.
For the rest of the country, IMD declares the advance of the monsoon operationally "in a subjective manner", weighing the sharp increase in rainfall, whether it lasts a few days and the change in winds [13]. In 2020 IMD published new normal dates for the whole country, based on 1961–2019 for the onset and 1971–2019 for the withdrawal [13]. Kerala stayed at 1 June. The monsoon now normally covers the whole country by 8 July rather than 15 July. It starts withdrawing from northwest India around 17 September instead of 1 September. That later withdrawal is consistent with what we find below.
How the local rains compare with IMD's normal dates
For much of central and northern India, the rain-based start of the season lands within a few days of IMD's normal date. In the south and the Northeast it does not. Pre-monsoon showers set in weeks before the monsoon circulation arrives, so the local rains start long before IMD's date. Farmers may draw the same line: in focus groups for a forecasting programme, reported in a recent preprint, they did not consider April or May rain to be monsoon rain [14].
| City (nearest grid cell) | IMD normal onset, 1961–2019 [13] | Rainy-season start, median 1979–2023 | Safe-sowing start, median 1979–2023 |
|---|---|---|---|
| Thiruvananthapuram | 1 June | 15 May | 16 May |
| Kochi | 1 June | 27 May | 23 May |
| Bengaluru | 3 June | 21 May | 22 May |
| Mumbai | 11 June | 12 June | 14 June |
| Pune | 10 June | 8 June | 14 June |
| Nagpur | 16 June | 15 June | 18 June |
| Dibrugarh | 4 June | 10 April | 12 April |
| Patna | 16 June | 13 June | 22 June |
| Ranchi | 14 June | 15 June | 19 June |
| Raipur | 16 June | 14 June | 19 June |
| Bhopal | 20 June | 18 June | 23 June |
| Ahmedabad | 26 June | 20 June | 3 July* |
| Varanasi | 23 June | 25 June | 3 July |
| Delhi | 27 June | 21 June | 2 July* |
| Jaipur | 29 June | 28 June | 8 July* |
| Dehradun | 20 June | 20 June | 23 June |
*No safe-sowing start by 30 September in 7 (Ahmedabad), 6 (Delhi) and 4 (Jaipur) of the 45 years; the median is over the other years.
The safe-sowing start usually comes a few days after the rainy-season start. In Patna and Varanasi, and in the drier west and northwest (Ahmedabad, Delhi, Jaipur), it comes more than a week later, because the first burst of rain there is often followed by a dry spell.
Is the monsoon arriving later in your district?
In most districts, no. Of the 621 districts with a usable record:
- In 26 districts, home to about 2.1 crore (21 million) people, the rainy season now starts clearly later.
- In 40 districts, home to about 7.0 crore (70 million) people, it starts clearly earlier.
- In the remaining 555 there is no clear change.
In the median district, the start moved just 1.2 days earlier. The safe-sowing start gives the same picture: clearly later in 18 of 535 districts where it can be worked out, clearly earlier in 45, with no district where the two definitions point in opposite directions.
Later: the Northeast
Sixteen of the 26 districts with a later start are in the Northeast, five of them in Arunachal Pradesh and four in Mizoram. In Lohit, the rains used to start in late March and now start at the end of April. In Kamrup Metropolitan, which includes Guwahati, the start moved from 22 April to 11 May. Averaged over the eight northeastern states, the season starts 3.5 days later, ends 5 days earlier and is about 8.5 days shorter. This matches the drying we found there in our earlier case study: average annual rain in these districts fell from about 2,550 mm to 2,290 mm, and July alone lost about 100 mm.
We are cautious about the Northeast for the same reason as before. Gauges are sparse in its hills, and the gridded values lean heavily on interpolation. Changes in which stations report can shift statistics from this dataset [15]. Fewer reporting gauges would make the early-season showers look weaker and the start later. The signal is consistent across neighbouring districts, but only a dense and stable gauge network could confirm it.
Outside the Northeast, a later start is rare and scattered. In Maharajganj in eastern Uttar Pradesh, the rains now start on 20 June on average instead of 7 June. In Dakshin Dinajpur in West Bengal they start on 4 June instead of 14 May.
Earlier: southern Karnataka and the south
The 40 districts with an earlier start are mostly in the south: 16 of Karnataka's districts, 6 in Kerala, all 4 of Sikkim's, 5 in Rajasthan and a few elsewhere. In Bengaluru district the rainy season used to start, on average, on 20 June. In 2009–2023 it started on 7 May. The reason is pre-monsoon rain. Bengaluru's April rain rose from about 26 mm to 60 mm and its May rain from 88 mm to 146 mm, so the season's running total turns upward weeks earlier. Across the southern states, April and May rain together rose from about 89 mm to 124 mm.
An earlier start of this kind is not the same as an earlier monsoon. It means the pre-monsoon showers have become wetter and more reliable, and they now merge into the monsoon rains. For a farmer, a wet May can be a chance to prepare land early. It can also be a trap, if the crop is sown before the rains have really settled.
The clearer change: rains lasting longer
The end of the season has moved more than the start. Averaged over India's monsoon area, the rainy season now ends about 5 days later and lasts about 8 days longer than in 1979–1993. Both are significant in a trend test over the 45 years (p = 0.049 and p = 0.029), although neither passes our stricter two-period rule nationally.
District by district, the season clearly lengthened in 78 districts, home to about 13.7 crore (137 million) people, and clearly shortened in 20, mostly in the Northeast. It ends clearly later in 72 districts and clearly earlier in only 11.
The northwest stands out. Across Rajasthan, Punjab, Haryana, Delhi and Chandigarh, the rainy season used to run from about 24 June to 4 September. It now runs from 19 June to 13 September, about 13 days longer, and it is clearly longer in 27 of the 86 districts. In Ludhiana the season used to end around 1 September and now ends around 15 September. Jaipur's end moved from 3 to 14 September.
The cause is more rain in September. Averaged over the districts of western India, September rain rose from about 145 mm to 228 mm. Mumbai Suburban's September rain rose from about 300 mm to 490 mm, and its season now ends on 25 September instead of 12 September. In Indore, September rain more than doubled, from about 96 mm to 211 mm.
How often is the monsoon more than two weeks late?
A late start is what hurts a rainfed farmer, so we counted the years in which a district's rains started more than 14 days after its usual date (its median over 1979–2023).
That has not become more common. A district had, on average, 2.3 such late years in 1979–1993 and 2.2 in 2009–2023. The number of districts with four or more late years in a 15-year period fell from 155 to 129. Early starts became a little more common: from 1.7 to 2.6 years per 15. The start has become somewhat more variable, mostly because of those early years. In a typical district, its year-to-year standard deviation rose from about 13 to 15 days.
That spread is the more important number. In a typical district, the local start varies from year to year about twice as much as the Kerala date, which has a standard deviation of about 6 days. And the Kerala date says little about the local start in a given year. Across Kerala's own districts, the correlation between IMD's onset date and the local start is about 0.44. Across all 621 districts, the median correlation is 0.16. It is statistically significant in only 136 districts. The link is strongest in the west, east and centre of the country, with median correlations of 0.24–0.32, and absent in the northwest and the Himalaya.
False starts are common and have not changed. In a typical year, over about 28% of India's monsoon area, the first good spell of rain was followed by a dry spell of 10 days or more. When that happened, the safe-sowing start came a median of 37 days after the first wet spell.
What the trend tests say
The two-period comparison can be swayed by a few unusual years. As a stricter check, we ran the Mann–Kendall test on every district's 45-year series and controlled the false discovery rate across districts, as Wilks recommends [16].
- Start of the rainy season: 5 districts have a significant trend towards a later start and 25 towards an earlier one.
- Safe-sowing start: none towards later, 7 towards earlier.
- Length of the season: 35 districts are significantly longer and 3 shorter.
No region shows a widespread, statistically robust trend towards a later monsoon. The most robust signal in the record is a longer season, through more rain in September in the west and northwest and more pre-monsoon rain in the south.
Why does the timing of the rains matter?
Sowing and rainfed farming
For most of India, 70–90% of the year's rain falls in June–September. IMD notes that the onset and duration of this season are important factors in agricultural planning, food security and the lives of the country's agricultural workforce of around 25 crore (250 million) people [13]. In 2025, the Ministry of Agriculture and Farmers Welfare sent forecasts of the local arrival of continuous rains by SMS to nearly 3.8 crore (38 million) farmers in 13 states. That year the monsoon arrived early, then stalled in its northward progress for 20 days [17].
A stall like that is what turns early rain into a false start for anyone who sows too soon, and it is the risk the safe-sowing start is designed to capture. Seed sown into the first rains can fail if a long dry spell follows. A recent preprint on onset forecasting for Indian farmers points out that a forecast that leads farmers to plant too early can cost them the crop [7]. With false starts in more than one year in four, a district needs its own record of when the rains really settle, not the Kerala date.
Reservoirs
The Central Water Commission tracks the live storage of 161 major reservoirs every week. On 8 May 2025, before the monsoon, they held 31.78% of their live storage capacity [18]. With 70–90% of the year's rain falling in June–September over most of India [13], when the rainy season begins and ends sets the window for inflows and for the trade-off between storing water for the dry season and keeping space for floods. A season that now runs later into September, as it does across much of western and northwestern India, shifts the last large inflows later as well. We explain what operators need to measure in reservoir level monitoring.
Getting ready before the rains
In much of the Northeast and the south, the local rains start in April or May, weeks before IMD's onset over Kerala. Pre-monsoon checks of gauges, sensors and sirens there need to be finished by the local start, not by the Kerala date. Our pre-monsoon readiness checklist for flood warning systems sets out what to check.
Why local onset needs local rain gauges
Everything in this article comes from a grid of 25 km cells built from rain gauges. That is the best long record India has, but it has three limits for this question.
First, the grid smooths. A local start depends on the first spell of rain that really lasts. A shower that soaks one village and misses the next becomes a modest wet day across a whole 25 km cell. Second, the record depends on which gauges report. IMD's own report on the new normal dates notes that station data are often biased and distributed unevenly in space and time, and that a change of method can introduce a bias that varies over time [13]. Our results for the Northeast, where the changes are largest, are the ones most exposed to this. Third, satellites cannot simply fill the gaps. When we compared satellite rainfall products with this IMD dataset, their ability to capture rainfall extremes varied strongly from region to region [19].
A district that wants to know when its rains have truly started, in time to advise its farmers, needs gauges that report daily or more often, spread across its blocks, and kept running for decades. We look at how many that takes in how many rain gauges does a district need.
What would help
- A local onset date alongside the Kerala date. Districts could publish when their own rains have set in, using a fixed definition such as the safe-sowing start, from gauges that report in real time.
- Sowing advice based on the local start, with a warning when a wet spell is likely to be a false start.
- Stable, dense gauge networks, especially in the Northeast and the hills, where our results are largest and least certain.
- Planning for a longer season where September rain has risen: reservoir operation, harvest timing and late-season flood readiness in the west and northwest.
Key points
- IMD's declared onset over Kerala has not moved. It averaged 1 June in 1979–93 and 2 June in 2009–23, with no trend.
- In 555 of 621 districts, the local rainy season starts when it did a generation ago. It starts clearly later in 26 districts (about 2.1 crore people), mostly in the Northeast, and clearly earlier in 40 (about 7.0 crore), mostly in southern Karnataka, Kerala and Sikkim.
- Starts more than two weeks late have not become more common: about 2 years in 15 in both periods. The local start varies from year to year about twice as much as the Kerala date, and the Kerala date says little about it.
- The clearer change is a longer season: about 8 days longer on average over India's monsoon area, and clearly longer in 78 districts (about 13.7 crore people), driven by more September rain in the west, northwest and centre and more pre-monsoon rain in the south.
- False starts, where the first good rain is followed by a dry spell of 10 days or more, affect more than a quarter of the monsoon area in a typical year.
- A local start needs local measurement: a 25 km grid and a single date for Kerala cannot tell a district when its rains have truly settled.
At ClimMaTech we work on measuring rain and water where they matter. VARSHAQ, our weather station in development, will record rainfall through the day where it falls, so that a local start can be seen as it happens. Tarang, a radar automatic water level recorder (AWLR), tracks river and reservoir levels as the rains arrive.
Method
Data: IMD 0.25° × 0.25° gridded daily rainfall [2][3], 1 January 1979 to 31 December 2023 (16,436 days). IMD provides the data for download, asks users to cite Pai et al. (2014) and states that it cannot guarantee the data are correct in all circumstances. IMD onset dates over Kerala: 1979–2007 from the table of operational dates in Pai and Rajeevan [9] (dates under the older criteria until 2005, and the same table's dates reworked with the 2006 criteria as a check); 2008 from IMD's monsoon report for that year [10]; 2009–2023 from IMD's list of past onset dates [1]. Normal onset dates for cities: IMD's 2020 research report [13], Table 2.
Grid cells: 4,964 cells with a complete record in at least 40 of the 45 years; a cell-year with any missing day was left out. Of these, 4,277 cells, 86.6% of the area, get at least half of their year's rain in June–September. All results are for these cells.
Rainy-season start and end: for each cell and calendar year, the running sum from 1 January of daily rain minus the cell's 1979–2023 average daily rain. Start: the day after the minimum between 1 March and 31 August. End: the day of the maximum between the start and 31 December [4][5]. Length: end minus start. In the far south, the end can include October rain that belongs partly to the northeast monsoon [5].
Safe-sowing start: from 1 April, the first day with at least 1 mm that begins a five-day spell whose total is at least the cell's average five-day rainfall in June–September of 1979–2023, and which is not followed by any 10-day window with less than 5 mm lying within the next 30 days [6][7]. Searched up to 30 September. Used only for cells with such a start in at least 40 of the 45 years (3,274 cells); elsewhere, mostly in the semi-arid northwest, Saurashtra and Kutch, dry spells after the first rains are so common that the start is often missing. False start: the first qualifying five-day wet spell was followed by such a dry spell.
Periods: 1979–1993 and 2009–2023, 15 years each, as in our earlier case studies.
Districts: 2011 Census boundaries [8]. Each district's value is the mean over the usable grid cells touching the district, provided they are at least half of its cells. "Clear" change: the difference between the two period means is at least twice its standard error, from the district's own year-to-year values. Late start: more than 14 days after the district's 1979–2023 median. Variability: standard deviation of the start within each period. Districts are shown as having no reliable record where the grid rests on very few gauges: Leh and Kargil, the part of Jammu and Kashmir with no 2011 Census district data, Saiha in Mizoram (no early record), and neighbouring Lawngtlai, whose 1979–93 record gives a July start and an annual total 37% below 2009–23. Population figures are from the 2011 Census; districts formed after 2011 are not counted in the population totals. Regions are groups of whole states.
Trend tests: Mann–Kendall test [11] with tie correction and Sen's slope [20] on the national series, each grid cell and each district's series. We controlled the false discovery rate across cells or districts with the Benjamini–Hochberg procedure at 0.10, which approximates a 5% overall test for spatially correlated fields [16]. The tests do not correct for serial correlation. Correlations with the Kerala date use the 45 years; 0.3 is about the 5% significance level.
Caveats: The station network behind the grid changes over time, which can affect rainfall statistics [2][15]. Gauges are sparse in the Northeast and the Himalaya. A rainfall-based start is not IMD's declared onset, which also uses winds and cloud. Two 15-year periods cannot separate long-term change from decadal variability. Maps are approximate and not to scale.
References
- India Meteorological Department, Southwest Monsoon has set in over Kerala and advanced into some parts of northeast India, today the 24th May, 2025, press release with Annexure 2, "Past date of monsoon onset over Kerala (2009–2025)", 24 May 2025. https://internal.imd.gov.in/press_release/20250524_pr_3998.pdf
- Pai, D.S., Sridhar, L., Rajeevan, M., Sreejith, O.P., Satbhai, N.S. and Mukhopadhyay, B., Development of a new high spatial resolution (0.25° × 0.25°) long period (1901–2010) daily gridded rainfall data set over India and its comparison with existing data sets over the region, Mausam 65(1), 1–18, 2014. https://doi.org/10.54302/mausam.v65i1.851
- India Meteorological Department, Pune, High resolution (0.25 × 0.25 degree) gridded daily rainfall data (NetCDF), IMD. https://www.imdpune.gov.in/cmpg/Griddata/Rainfall_25_NetCDF.html
- Liebmann, B., Camargo, S.J., Seth, A., Marengo, J.A., Carvalho, L.M.V., Allured, D., Fu, R. and Vera, C.S., Onset and end of the rainy season in South America in observations and the ECHAM 4.5 atmospheric general circulation model, Journal of Climate 20(10), 2037–2050, 2007. https://doi.org/10.1175/JCLI4122.1
- Misra, V., Bhardwaj, A. and Mishra, A., Local onset and demise of the Indian summer monsoon, Climate Dynamics 51(5–6), 1609–1622, 2018. https://doi.org/10.1007/s00382-017-3924-2
- Moron, V. and Robertson, A.W., Interannual variability of Indian summer monsoon rainfall onset date at local scale, International Journal of Climatology 34(4), 1050–1061, 2014. https://doi.org/10.1002/joc.3745
- Masiwal, R., Aitken, C., Marchakitus, A., Gupta, M., Kowal, K., Pahlavan, H.A., Yang, T., Sun, Y.Q., Kremer, M., Jina, A., Boos, W.R. and Hassanzadeh, P., Decision-oriented benchmarking to transform AI weather forecast access: application to the Indian monsoon, arXiv 2602.03767, 2026 (preprint). https://arxiv.org/abs/2602.03767
- Office of the Registrar General and Census Commissioner, India, Census of India 2011: census tables (Primary Census Abstract), Ministry of Home Affairs, 2011. https://censusindia.gov.in/census.website/data/census-tables
- Pai, D.S. and Rajeevan, M., Summer monsoon onset over Kerala: new definition and prediction, Journal of Earth System Science 118(2), 123–135, 2009. https://doi.org/10.1007/s12040-009-0020-y
- India Meteorological Department, Monsoon 2008: A Report, Met. Monograph Synoptic Meteorology No. 7/2009, National Climate Centre, IMD Pune, 2009 (archived copy). https://iri.columbia.edu/~awr/TP/India/pubs/2008_monsoon_report.pdf
- Mann, H.B., Nonparametric tests against trend, Econometrica 13(3), 245–259, 1945. https://doi.org/10.2307/1907187
- India Meteorological Department, Forecast of the onset date of southwest monsoon – 2020 over Kerala, press release, 15 May 2020. https://internal.imd.gov.in/press_release/20200515_pr_801.pdf
- Pai, D.S., Bandgar, A., Devi, S., Musale, M., Badwaik, M.R., Kundale, A.P., Gadgil, S., Mohapatra, M. and Rajeevan, M., New normal dates of onset/progress and withdrawal of southwest monsoon over India, CRS Research Report No. 3/2020, India Meteorological Department, Pune, 15 May 2020. https://internal.imd.gov.in/press_release/20200515_pr_804.pdf
- Aitken, C., Masiwal, R., Marchakitus, A., Kowal, K., Gupta, M., Yang, T., Jina, A., Hassanzadeh, P., Boos, W.R. and Kremer, M., Designing probabilistic AI monsoon forecasts to inform agricultural decision-making, arXiv 2603.07893, 2026 (preprint). https://arxiv.org/abs/2603.07893
- Lin, M. and Huybers, P., If rain falls in India and no one reports it, are historical trends in monsoon extremes biased?, Geophysical Research Letters 46(3), 1681–1689, 2019. https://doi.org/10.1029/2018GL079709
- Wilks, D.S., "The stippling shows statistically significant grid points": how research results are routinely overstated and overinterpreted, and what to do about it, Bulletin of the American Meteorological Society 97(12), 2263–2273, 2016. https://doi.org/10.1175/BAMS-D-15-00267.1
- Press Information Bureau, Ministry of Agriculture and Farmers Welfare, Government's first-of-its-kind AI-based weather forecasting program for agriculture, reaching 3.8 crore farmers, 12 September 2025. https://www.pib.gov.in/PressReleasePage.aspx?PRID=2166074
- Central Water Commission, Weekly bulletin on live storage status of 161 reservoirs in the country as on 08.05.2025, Water Management Directorate, CWC, 2025. https://cwc.gov.in/sites/default/files/bulletin-08-05-2025.pdf
- Gupta, V., Jain, M.K., Singh, P.K. and Singh, V., An assessment of global satellite-based precipitation datasets in capturing precipitation extremes: a comparison with observed precipitation dataset in India, International Journal of Climatology 40(8), 3667–3688, 2020. https://doi.org/10.1002/joc.6419
- Sen, P.K., Estimates of the regression coefficient based on Kendall's tau, Journal of the American Statistical Association 63(324), 1379–1389, 1968. https://doi.org/10.1080/01621459.1968.10480934
Data credits: rainfall data and onset dates from the India Meteorological Department; district boundaries and population from the Census of India 2011. Analysis, maps and charts: ClimMaTech.