
What is an automatic weather station (AWS)? How it works
The sensors on the mast, what the logger does with their signals every second and every ten minutes, and why an AWS record is not quite the same as a manual one.

Imagine a district emergency officer during a cyclone warning, looking at a dashboard: a strong gust at one coastal station, a large rainfall total since morning at another, and no data at all from a third. Every one of those numbers, and the gap, comes from an automatic weather station. To use them well, it helps to know what an automatic weather station is, how it turns weather into numbers, and where those numbers can mislead.
This article follows the station from the top of the mast to the central server. The reference throughout is the World Meteorological Organization's Guide to Instruments and Methods of Observation (WMO-No. 8) [1][2], with examples from India.
What is an automatic weather station?
An automatic weather station (AWS) is, in WMO's definition, a "meteorological station at which observations are made and transmitted automatically" [1]. Sensors convert weather variables into electrical signals; electronics turn the signals into meteorological values; and the station records and sends them without an observer [1].
WMO distinguishes light stations (one or two variables, such as rainfall or temperature), basic stations (typically temperature, humidity, wind, precipitation and sometimes pressure) and extended stations that add solar radiation, sunshine duration, soil temperature or evaporation [1]. An AWS is also one part of a system: the station and its sensors, the modem that connects it to a network, and the central system that collects data from every station [1].
Automation brings data from sites where nobody lives, around the clock, by standard methods; the costs are more technicians and a change in the nature of some records [1].
What are the components of an automatic weather station?
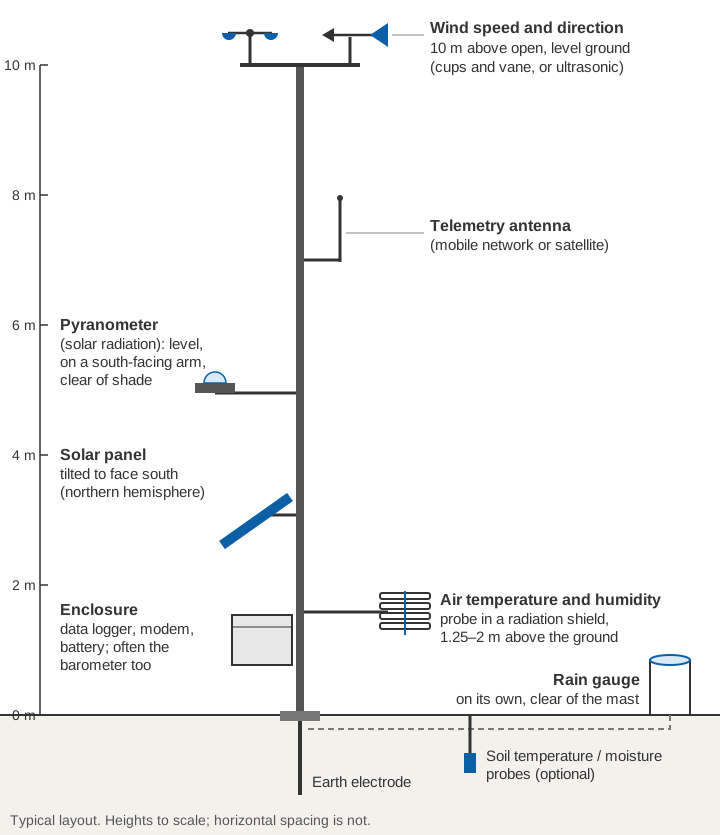
The components are the sensors, a data logger, a power supply, a telemetry link and the mast or structure that holds them.
Air temperature, inside a radiation shield
A sensor in sunshine heats up and stops reading the air temperature. WMO notes that the error "may reach 25 K under extremely unfavourable conditions", so the sensor sits in a screen or shield that blocks radiation and rain but lets air flow through [2]. AWS normally use a platinum resistance thermometer (a Pt100 has a resistance of about 100 Ω at 0 °C) or a thermistor, whose resistance changes with temperature [2][3]. Air temperature is measured 1.25–2 m above the ground, over natural ground, preferably grass, because temperature changes steeply with height near the surface [2]. Poor ventilation of the shield (wind below 1 m/s) in strong sunshine is a known source of error [2].
Relative humidity
The usual sensor is a capacitive polymer element: a thin polymer film between two electrodes takes up water vapour, and its capacitance changes with relative humidity [2]. It shares the temperature sensor's shield [2], and many probes heat the element near saturation to keep condensation off it [2]. The logger calculates dew point from temperature and humidity [1].
Barometric pressure
Electronic barometers have replaced mercury instruments, whose production, import and export the Minamata Convention bans [1][2]. They use a capacitive diaphragm, a piezoresistive element or a resonant sensor whose vibration frequency changes with pressure [2]. WMO "highly recommends" a digital output on an AWS, so that analogue conversion adds no uncertainty [1]. Some barometers carry two or three cells, so drift shows up when the cells disagree [1].
Wind speed and direction
- Cup or propeller anemometers with a vane. The rotor turns at a rate proportional to wind speed; the vane points into the wind. In gusty air, some cup designs can over-read by as much as 10 % [2].
- Ultrasonic (sonic) anemometers. They time ultrasonic pulses over a fixed distance, which the moving air changes. With no moving parts they are durable and their accuracy changes little with time [2].
The standard exposure is 10 m above open, level ground, with obstacles at least ten times their own height away [2]. Wind direction is the direction the wind blows from, measured clockwise from true north [2].
Rainfall
Many AWS, including IMD's, use a tipping-bucket gauge: a small bucket tips each time it holds a fixed depth of rain and sends a pulse to the logger. In IMD's satellite-linked network described in 2012, the collector was 20 cm across and each tip was 0.5 mm [3]:
Collector area  = π × (10 cm)² = 314.2 cm²
Volume per tip  = 314.2 cm² × 0.05 cm (0.5 mm) = 15.7 cm³
Gauge types, and the errors of tipping buckets in heavy rain, are covered in types of rain gauges used in India and tipping-bucket rain gauge errors.
Solar radiation
A pyranometer measures global solar radiation: sunlight (300–3,000 nm) reaching a horizontal surface from the whole sky, direct and diffuse together [2]. Its sensor, under a glass dome, is usually a thermopile, which gives a small voltage as it warms, or a silicon photodiode [1][3]. It must be level, with nothing above the plane of the sensor and no light-coloured wall reflecting onto it [2]. Dome cleaning is one task automation does not do, and WMO notes that data quality can suffer for it [1].
Soil and other sensors
Extended stations add soil temperature probes, usually thermistors, and sometimes soil moisture probes, which infer water content from the soil's dielectric properties [1][3].
Sensors at a glance
| Sensor | What it measures | Typical principle | Key WMO recommendation |
|---|---|---|---|
| Air temperature | Air temperature, °C | Platinum resistance thermometer or thermistor in a radiation shield | 1.25–2 m above natural ground; 1-minute average; required uncertainty 0.1 K between −40 and +40 °C [2] |
| Relative humidity | Relative humidity, % | Capacitive polymer film | Same shield and height as temperature; 1-minute average; 3 % listed as achievable for solid-state sensors [2] |
| Barometer | Station pressure, hPa | Capacitive, piezoresistive or resonant sensor | Digital output preferred on an AWS [1]; 0.1 hPa resolution and required uncertainty; 1-minute average [2] |
| Wind | Speed (m/s) and direction (degrees from true north) | Cups or propeller with vane, or ultrasonic | 10 m over open terrain; 2- and/or 10-minute averages; gust = highest 3-second average; direction to 5° [2] |
| Rain gauge | Rainfall, mm | Tipping bucket or weighing gauge | Daily amount to 0.1 mm; required uncertainty 0.1 mm up to 5 mm, 2 % above [2] |
| Pyranometer | Global solar radiation, W/m²; daily exposure, J/m² | Thermopile or silicon photodiode under a glass dome | Level and unshaded; daily total: required uncertainty 2 %, achievable 5 % [2] |
| Soil temperature (optional) | Soil temperature, °C | Thermistor or resistance thermometer | 0.1 K resolution; 1-minute average [2] |
"Required" is what WMO asks of operational measurements; "achievable" is what good instruments deliver in practice [2].
How does an automatic weather station work?
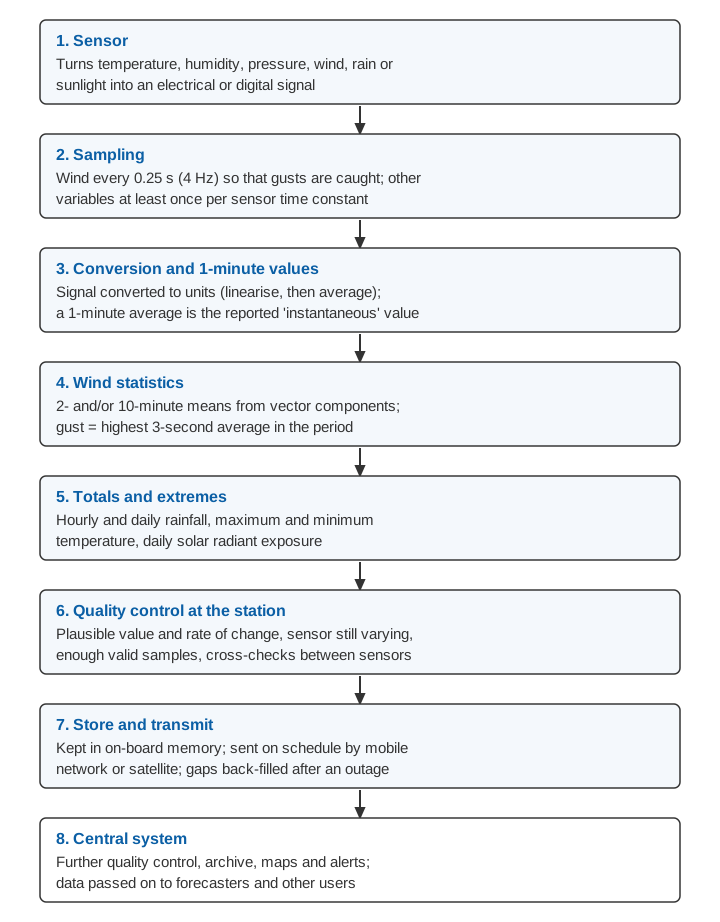
The heart of the station is a data logger: a small computer that reads the sensors, converts and averages their signals, checks the results, stores them and passes them to the modem [1].
Sampling and averaging
Sampling means reading a sensor at fixed intervals. WMO's rule of thumb is at least once per sensor time constant (the time the sensor takes to respond to a change) [1]. To catch gusts, the wind signal should be sampled every 0.25 s (4 Hz) [2]; many anemometers do this internally and hand the logger a summary each minute [1].
Averaging smooths out turbulence and electronic noise. WMO recommends that the reported "instantaneous" value of most variables be a 1-minute average, wind and visibility excepted [1]:
- Wind is averaged over 10 minutes for synoptic reports and 2 minutes for local aviation use [1][2]. A 1-minute "average" does not smooth natural turbulence and is better called a long gust [2].
- A gust is the highest 3-second average; a gust of about 3 s suits most users, from warnings to wind loads on buildings [2].
- Totals and extremes follow: hourly and daily rainfall, maximum and minimum temperature, daily radiant exposure [1].
The logger should convert signals to physical units before averaging, because averaging a non-linear signal first gives a different answer [1]. Wind direction must be averaged from the wind's components, not from the angles [2].
Worked example (illustrative). Two 1-minute readings, both 5 m/s, come from 350° and 10°: just west and just east of north.
Average of the angles:   (350° + 10°) / 2 = 180°   ← from the south: wrong

Using components:
  350°: sin = −0.174, cos = 0.985
   10°: sin = +0.174, cos = 0.985
  Mean: sin = 0,      cos = 0.985
  Direction = atan2(0, 0.985) = 0°                 ← from the north: right
  Vector mean speed = 5 × 0.985 = 4.9 m/s   (scalar mean = 5.0 m/s)
Whenever the direction wanders, the vector mean speed is a little lower than the scalar mean, so stations that average differently will not agree exactly. WMO also advises keeping a register of the algorithms and software versions in the station's metadata, since small changes can shift a record [1].
Storage, power and telemetry
Links fail, so the station keeps its own record, in a circular memory sized to the site, "up to several months for a very isolated site", and sends older data on when the link returns [1].
WMO recommends a 12 V direct-current supply [1]. Remote stations run on batteries, usually charged by solar panels, sometimes by a generator [1]. Heated sensors, fans and cloud or visibility instruments need more power than a small solar system can give [1]. The station should report its battery voltage and charging current, and switch off before the battery is deeply discharged [1]. IMD's 2012 network, for example, used a 12 V, 65 Ah sealed battery float-charged by a 30 W solar panel [3]. See sizing solar power for an off-grid monitoring station.
Links include mobile networks, satellites, telephone lines and the internet; because coverage and prices change, WMO advises designing the station so the modem is easy to replace [1]. It recommends real-time stations even for climate records, since an offline station neither delivers data in time nor reveals a fault quickly [1]. IMD's 2012 network sent hourly data by UHF radio through a meteorological satellite to a receiving station at Pune, and set each station's clock from GPS at least once a day [3]. See telemetry link design for hydromet stations.
Quality control
Quality control (QC) is the set of automatic checks that catch wrong or missing data. WMO's real-time checks include [1]:
- Plausible value: within physical and climatological limits.
- Plausible rate of change: no impossible jump from the last good value.
- Minimum variability: a reading that stops changing may mean a stuck sensor, such as a jamming cup anemometer.
- Enough valid samples to form an average.
- Cross-checks: dew point cannot exceed air temperature; wind speed with no variation in direction suggests a faulty vane.
The station also sends status ("housekeeping") data so faults can be found remotely, and when 1-minute data reach the centre, most checks can run there [1]. See data quality control for hydromet time series.
Siting basics
Conventional siting rules apply to AWS too [1]: level, open ground, away from slopes, hollows and rooftops, with wind sensors clear of obstacles [2], and protection against lightning, flooding and theft [1].
Automatic weather stations in India
IMD set up a satellite-linked network of 125 AWS in 2006–07, planned "especially" for cyclone warning, which is why many stations stand on the coast [3]. IMD and state agencies now run much larger AWS and automatic rain-gauge networks, described in India's automatic weather station and rain-gauge networks.
Uses in agriculture and hydrology
Agriculture. The FAO method for crop water requirements (FAO-56) computes reference evapotranspiration from maximum and minimum temperature, humidity, net radiation and wind speed at 2 m [4]. Meteorological anemometers sit at 10 m, so FAO gives a conversion, with this worked example [4]:
u₂ = u_z × 4.87 / ln(67.8 z − 5.42)          (FAO-56, Eq. 47)
z = 10 m:   4.87 / ln(672.58) = 4.87 / 6.511 = 0.75
3.2 m/s at 10 m  →  3.2 × 0.75 = 2.4 m/s at 2 m
Hydrology. Rainfall is the main input to flood forecasting, and WMO's flood manual notes that local observations "by telemetric raingauges or radar" become especially important where local flood response differs from that of the wider catchment [5]. Temperature, humidity, wind and radiation feed evaporation estimates for water balances [4].
Why are automatic weather stations important for disaster management?
They report in near real time, day and night, from places where nobody is posted to read an instrument [1]. During a cyclone, cloudburst or heat wave, warning centres and district control rooms can see rain totals, gusts and temperatures as they happen, from their own area. IMD's 2012 paper names cyclone warning and flash-flood forecasting among the uses of its AWS network [3]. How such data become warnings is explained in how a flood early warning system works.
Why AWS data differ from manual observations
When a station moves from an observer to an AWS, the record often shifts. IMD's comparison names three causes [3]:
- Sensors: a mercury-in-glass thermometer against a thermistor or Pt100; a cup anemometer against an ultrasonic sensor.
- Averaging: the AWS took a vector average of 180 one-second wind samples over three minutes, the observatory a scalar average.
- Place and height: co-located AWS stood 20–200 m from the observatory, sometimes with sensors at different heights.
At Pune, AWS daily maximum temperature was about 0.5 °C lower and daily minimum about 0.4 °C higher than the observatory's. AWS rainfall was lower on average by 1.0 mm, attributed to lost tips at high rain rates and evaporation from the heated metal collector [3]. In Italy and Canada, paired records showed 10 % more warm days and 35 % more extremely warm days in the automatic series, enough to bias studies of extremes if the two are simply joined [6]. WMO therefore advises running old and new systems in parallel before switching, preferably for at least two years [1].
None of this makes AWS data worse; the change of method simply belongs in the station's metadata.
Key points
- An AWS measures, processes and sends weather data automatically, as one part of a system with a link and a central server.
- Standard heights matter: wind at 10 m; temperature and humidity at 1.25–2 m in a radiation shield; a level, unshaded pyranometer.
- The logger samples, converts, then averages: 1-minute values for most variables, 2- and/or 10-minute wind means, and a 3-second gust.
- Power, local storage, telemetry and automatic checks decide whether data arrive and whether they can be trusted.
- AWS and manual records differ in sensors, averaging and siting; compare them side by side before joining them.
Where ClimMaTech fits
Catchment weather drives the rivers we monitor, so the same care with exposure, averaging and quality control runs through our own work. VARSHAQ, our weather station, is in development. Rain gauges and weather stations can report into the same real-time network as river stations, as described on our RTDAS and hydromet telemetry page, and our approach to warnings is on the flood warning page.
References
- World Meteorological Organization, Guide to Instruments and Methods of Observation, Volume III: Observing Systems, Chapter 1 "Measurements at automatic weather stations", sections 1.1–1.6, WMO-No. 8, 2024 edition. WMO e-Library.
- World Meteorological Organization, Guide to Instruments and Methods of Observation, Volume I: Measurement of Meteorological Variables, Chapter 1 "General" (Annex 1.A), Chapter 2 "Measurement of temperature", Chapter 3 "Measurement of atmospheric pressure", Chapter 4 "Measurement of humidity", Chapter 5 "Measurement of surface wind" and Chapter 7 "Measurement of radiation", WMO-No. 8, 2024 edition. WMO e-Library.
- M.R. Ranalkar, R.P. Mishra, A. Anjan and S. Krishnaiah, Network of Automatic Weather Stations: Pseudo random burst sequence type, MAUSAM, 63(4), 587–606, 2012. doi:10.54302/mausam.v63i4.412.
- R.G. Allen, L.S. Pereira, D. Raes and M. Smith, Crop evapotranspiration – Guidelines for computing crop water requirements, FAO Irrigation and Drainage Paper 56, Chapter 3 "Meteorological data", FAO, 1998. fao.org.
- World Meteorological Organization, Manual on Flood Forecasting and Warning, WMO-No. 1072, 2011 edition, Chapter 5. WMO PDF.
- F. Acquaotta, S. Fratianni, E. Aguilar and G. Fortin, Influence of instrumentation on long temperature time series, Climatic Change, 156, 385–404, 2019. doi:10.1007/s10584-019-02545-z.