
Float method of discharge measurement: a field guide
How to measure a river's flow with floats, a stopwatch and a surveyed cross-section, when a current meter cannot go in the water.

A river is in flood, the water is carrying logs and debris, and nobody can safely lower a current meter into it. Yet this is exactly the flow that most needs measuring. The oldest answer is still a good one: discharge measurement by the float method. Time something floating over a known distance, convert that surface speed into a mean speed, and multiply by the cross-section area.
How is river flow measured?
River flow, or discharge, is measured as the volume of water passing a cross-section each second, in cubic metres per second (m³/s). The usual way is the velocity-area method: divide the section into segments, multiply each segment's area by its mean velocity, and add up. Routinely the velocity comes from a current meter or acoustic instrument in the water, as described in the velocity-area method: how rivers are gauged by hand.
The float method is the same calculation with one change: velocity is measured at the water surface by timing floats. The international standard for velocity-area methods, ISO 748:2021, covers "surface velocity measurement including floats" alongside current meters and acoustic devices [1]. India's IS 1192:2024 is identical to it under dual numbering [2].
When are floats used?
Floats are used when a current meter cannot be: in floods where the measuring structure has been destroyed or a meter cannot be used, and where velocity is too low for a reliable meter reading [3][4]. The Central Water Commission (CWC) field manual uses floats only when current metering is not possible, most often in floods, and also where metering facilities are not yet installed or during a preliminary survey for a new station [5].
In practice that means:
- floods, when high velocity, drift or danger rule out a meter;
- quick estimates, for example during a site reconnaissance;
- small streams and remote sites where no equipment is at hand.
Choosing a straight, uniform reach
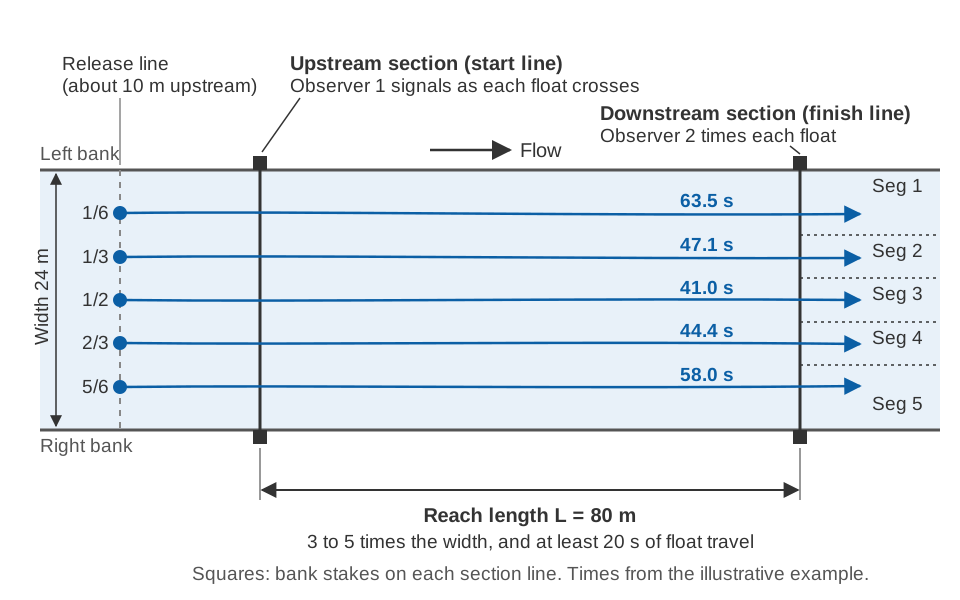
The float method needs two cross-sections on a straight channel: an upstream section where timing starts and a downstream section where it stops, with the reach between them. How long should the reach be? The CWC manual asks for 3 to 5 times the river width, or at least 20 seconds of float travel [5]. WMO and USGS also recommend at least 20 seconds, shorter only on small, fast streams with no longer straight stretch [3][4]. Look for:
- straight banks and a fairly uniform section, so floats travel parallel to the banks;
- no bridge piers, bends or obstructions within the reach. If the reach lies downstream of a bridge, CWC asks for the upstream section to be far enough away to avoid the turbulence [5];
- banks where two observers can stand and see each other.
Mark both section lines with stakes or markers on both banks, so that the moment a float crosses each line is clear [3][5]. At stations where float gauging is expected, CWC surveys both sections in advance, ties them to the zero of the staff gauge and resurveys them at least once a year before the monsoon [5]. Why sections change and how often to repeat a survey is covered in river cross-section surveys.
Surface floats and rod floats
A surface float can be almost anything that floats: wooden discs, partly filled bottles, even oranges. Floating debris can serve as natural floats [3][4]. Surface floats ride in the top few centimetres, so they measure surface velocity.
A rod float is a wooden rod weighted at one end so it floats upright. Because it reaches down into the flow, it moves at something closer to the mean velocity over its length. Rods must not touch the bed and are sometimes made in sections so the length can be matched to the depth [3][4].
CWC uses a near-surface rod 0.4 m long and 4 cm across, weighted to float nearly upright with one third above water to limit the effect of wind, and brightly painted. A 0.25 m rod is used in flow shallower than about 1.5 m [5].
How to measure discharge of a stream with floats
To measure the discharge of a stream with floats, you time several floats across the width over the reach, convert each surface velocity to a mean velocity, and multiply by the area of the segment each float represents. Step by step:
- Divide the width into segments. CWC uses an odd number, usually five or seven, so that one float runs down the middle; more than seven is rarely practical unless floats are dropped from a bridge [5]. For five segments the floats go at 1/6, 1/3, 1/2, 2/3 and 5/6 of the width; for seven at 1/8, 1/4, 3/8, 1/2, 5/8, 3/4 and 7/8 [5].
- Release each float upstream of the start line, far enough for it to reach the speed of the current. About 10 m is usually enough [5].
- Time it between the lines. The upstream observer signals as the float crosses the start line and the downstream observer, as timekeeper, stops the watch at the finish, to the nearest 0.1 s [5]. Note where it crosses the downstream section [3][4].
- Repeat bad runs. A float that snags on the bank or debris is ignored and the run repeated [5].
- Read the staff gauge, since the segment areas depend on water level.
Each float gives a surface velocity:
surface velocity  v_s = L / t
  L = distance between the two sections (m)
  t = travel time of the float (s)
From surface velocity to mean velocity: the float coefficient
Water at the surface moves faster than the average over the depth, because the bed slows the flow beneath it. The mean velocity in a vertical is found by multiplying the float velocity by a float coefficient, k:
mean velocity v_m = k × v_sWMO and USGS state that a coefficient of about 0.85 is commonly used to convert surface velocity to mean velocity; USGS gives 0.85 to 0.88 [3][4]. CWC uses 0.85 unless current-meter measurements at the site show a different value [5].
The coefficient depends on the shape of the vertical velocity profile (how velocity changes from surface to bed) and on how deep the float reaches [3][4]. For surface velocities WMO gives a typical range of about 0.84 to 0.90: higher values over smooth beds with a normally shaped profile, lower values over irregular beds [3]. It may also vary with stage, depth and position across the section, which is why profiles measured at the site are the best way to set it [3]. For rod floats the coefficient ranges from 0.85 to 1.00, depending on the shape of the section, the length of the rod and the velocity distribution; a rod reaching nearly to the bed needs little correction [3][4].
Just after a flood crest, drift often eases enough for a current meter to be used, and those readings help define the site coefficient [3][4].
Cross-section area and discharge by segments
Each float's mean velocity is applied to a segment area. CWC tabulates segment areas against staff gauge level for the upstream and downstream sections and uses the mean of the two [5]. If no survey exists, stake the water's edge at both sections during the flood and survey them later, when conditions allow [3][4].
Then, as for a current-meter gauging [3][5]:
segment discharge   q_i = a_i × v_m,i
total discharge     Q = Σ q_i
mean velocity       V = Q / A ,  where A = Σ a_i
Worked example
An illustrative gauging: a straight reach 24 m wide, sections L = 80 m apart (3.3 times the width), five rod floats and k = 0.85. Segment boundaries lie halfway between floats, at 6, 10, 14 and 18 m from the left bank, so the outer segments are 6 m wide and the inner ones 4 m.
| Segment (width) | Area upstream (m²) | Area downstream (m²) | Mean area a (m²) | Time t (s) | v_s = 80 / t (m/s) | v_m = 0.85 × v_s (m/s) | q = a × v_m (m³/s) |
|---|---|---|---|---|---|---|---|
| 1 (0–6 m) | 4.2 | 4.6 | 4.4 | 63.5 | 1.260 | 1.071 | 4.71 |
| 2 (6–10 m) | 6.0 | 5.6 | 5.8 | 47.1 | 1.699 | 1.444 | 8.38 |
| 3 (10–14 m) | 7.4 | 7.0 | 7.2 | 41.0 | 1.951 | 1.658 | 11.94 |
| 4 (14–18 m) | 6.6 | 6.8 | 6.7 | 44.4 | 1.802 | 1.532 | 10.26 |
| 5 (18–24 m) | 5.0 | 4.4 | 4.7 | 58.0 | 1.379 | 1.172 | 5.51 |
| Total | 28.8 | 40.80 |
Every travel time exceeds 20 seconds. The total is 4.71 + 8.38 + 11.94 + 10.26 + 5.51 = 40.80 m³/s, and the mean velocity is 40.80 / 28.8 = 1.42 m/s.
The coefficient matters. Across WMO's typical range for surface velocities, 0.84 to 0.90 [3], the same timings give 40.80 × 0.84 / 0.85 = 40.32 m³/s and 40.80 × 0.90 / 0.85 = 43.20 m³/s, a spread of about 7 % from the coefficient alone. That is why a site-specific value, checked with a meter when possible, is worth the effort.
Try it yourself
The figures are illustrative; the calculator does not round intermediate steps, so a row may differ from the table in the last digit.
What goes wrong: sources of error
Under favourable conditions, float measurements may be accurate to within about ±10 %. With a poor reach and too few float runs, the error can reach 25 % [3][4]. The main culprits:
- Wind. It pushes surface floats and can change their speed, especially when the current is slow [3][4]. Low-freeboard rods reduce this [5]; avoid gauging in strong wind if you can.
- An unsuitable reach. Bends, changes of section and obstructions make floats wander and the two sections unrepresentative of the reach.
- Eddies and cross-currents. Where floats drift across the channel, CWC first runs trials to find where floats released at each position actually arrive, and divides the downstream section accordingly [5].
- Too few floats. Each float stands for a whole segment, so one stray run can bias the result. WMO and USGS name too few float runs, together with a poor reach, as the cause of errors up to 25 % [3][4].
- The coefficient. As the worked example shows, a few hundredths in k change the result by several percent.
How these errors combine is explained in measurement uncertainty for water data. A float gauging is still useful: a flood peak measured to ±10–25 % is far better than none, and such points help define the upper end of a rating curve.
Floats, canals and radar
Canals are a different case, often measured with flumes and weirs, as discussed in how to measure canal discharge. In natural rivers the float method's weak link is that it gives a handful of surface velocities, once, by hand. A surface velocity radar measures the same surface velocity from above, continuously and without anyone at the water's edge, while the area and coefficient steps stay the same; see can radar measure river discharge?.
Key points
- The float method is the velocity-area method with surface velocities from timed floats, covered by ISO 748:2021 (IS 1192:2024).
- Use it in floods, for quick estimates and where no meter can be used.
- Choose a straight, uniform reach 3 to 5 times the width, with at least 20 s of float travel.
- Time floats at an odd number of positions across the width, to 0.1 s.
- Mean velocity is about 0.85 times surface velocity (typically 0.84 to 0.90; rod floats 0.85 to 1.00). Calibrate it at your site.
- Expect ±10 % at best and up to 25 % with a poor reach and few runs.
At ClimMaTech we build instruments that take the hard, repetitive part of this job off the river bank. PRAVAAH, our non-contact discharge sensor, combines an AWLR (Automatic Water Level Recorder) with an SVR (Surface Velocity Radar): it measures surface velocity continuously from above and, with a surveyed cross-section and a coefficient calibrated for the site, reports discharge. In effect it is an automated, continuous version of the float method's surface-velocity step. You can read more about our approach on the river monitoring page.
References
- International Organization for Standardization, ISO 748:2021 Hydrometry — Measurement of liquid flow in open channels — Velocity area methods using point velocity measurements, 5th edition, ISO, 2021. iso.org
- Bureau of Indian Standards, IS 1192:2024 Hydrometry — Measurement of liquid flow in open channels — Velocity area methods using point velocity measurements (Third Revision), identical with ISO 748:2021, BIS, 2024. services.bis.gov.in
- World Meteorological Organization, Manual on Stream Gauging, Volume I: Fieldwork, WMO-No. 1044, WMO, 2010, Sections 5.3.16, 5.4.6 and 8.3. wmo.int (PDF)
- D. P. Turnipseed, V. B. Sauer, Discharge measurements at gaging stations, U.S. Geological Survey Techniques and Methods, book 3, chapter A8, USGS, 2010, sections "Float measurements" and "Not possible to put the weight and meter in water". pubs.usgs.gov
- Central Water Commission, Gauge & Discharge Measurement Field Manual, Volume 4 Hydrometry, Part III Float measurements, River Data Directorate, CWC, January 2005. cwc.gov.in (PDF)