
Almost 1,000 mm in a day: India's wettest days on record
We searched 45 years of IMD gridded rainfall for India's wettest single days: where they fall, when, whether they are becoming more common, and how far a 25 km grid sits from what rain gauges record.

In the 24 hours ending at 8:30 am on 17 June 2022, the India Meteorological Department (IMD) rain gauge at Sohra, the town better known as Cherrapunji, collected 97 cm of rain [1]. News reports gave the exact figure as 972 mm, and recalled that the same station had logged 1,563.3 mm in a single day in June 1995 [2].
Those are numbers for a single gauge, a funnel a few centimetres wide. Most planning in India does not use single gauges. It uses gridded rainfall: IMD's national dataset, which spreads the country's gauge readings over a grid of cells about 25 km across. So we asked a simple question of that grid. What is the most rain it has ever recorded in a day, where, and when?
The answer is 979 mm, in the 24 hours to 8:30 am on 17 June 2022, in a cell over South West Khasi Hills in Meghalaya, a few tens of kilometres west of Sohra. In 45 years and more than 80 million cell-days, no cell has reached 1,000 mm. Almost 1,000 mm in a day is real. A full 1,000 mm is, on the grid, not yet.
This case study looks at India's wettest days: where they fall, in which months, whether they are becoming more common, how a district's wettest day compares with its normal year, and why the grid and the gauges so often disagree about the worst days of all. It builds on our case study of heavy rain days, which looked at how often rain crosses 64.5 mm. Here we look at how far past that line the worst days go.
How we looked
We used IMD's 0.25° × 0.25° gridded daily rainfall [3][4] from 1 January 1979 to 31 December 2023: 4,964 land cells over 16,436 days. IMD builds this dataset by interpolating the daily readings of its rain gauges onto the grid, using the nearest one to four gauges within 1.5° of each grid point [3].
Each daily value in the grid is the rain of the 24 hours ending at 8:30 am IST on that date, the same day on which IMD reports a station's 24-hour total. The data show this directly: the Mumbai deluge of the afternoon of 26 July 2005 appears in the grid on 27 July, the date of the Santacruz observatory's record reading [5].
We used these terms throughout:
- Cell-day: one grid cell on one day.
- Extremely heavy rain: 204.5 mm or more in 24 hours, IMD's highest category [6]. We also counted days of 300, 500 and 700 mm or more.
- Event: cell-days of 300 mm or more that are no more than one day and about 150 km (1.5°) apart are counted as one event, so a single storm that soaks 20 neighbouring cells counts once.
- Supported: a cell-day is supported if at least one of its eight neighbouring cells received at least half as much rain that day. A storm big enough to put 600 mm on one cell almost always puts a lot on the next one too. A value that stands alone, with dry or nearly dry cells all around it, is more likely to come from a single faulty gauge record. We set unsupported values aside. This removes a small share of the extremes (13 of the 216 cell-days of 500 mm or more) and changes none of the conclusions, but it does change a few district records, which we come back to.
- District wettest day: the highest supported one-day value in any grid cell whose centre lies inside the district (2011 Census boundaries [7]). For 23 very small districts with no cell centre inside, we used the cells that touch the district. We then compared that day with the same cell's total for that year, its average year and its average for that calendar month, all over 1979–2023.
The full method is at the end.
What is the highest rainfall in a day in India?
On IMD's grid, it is 979 mm, in South West Khasi Hills, Meghalaya, on 17 June 2022. Rain gauges have recorded more. IMD's Sohra gauge measured 97 cm that same day [1] (972 mm as reported [2]), and the same station is reported to have recorded 1,563.3 mm on 16 June 1995 [2].
Days like these are very rare even on the grid. Out of more than 80 million cell-days since 1979:
| One-day rain | Cell-days | Separate days on which it happened |
|---|---|---|
| 300 mm or more | 2,667 | 781 |
| 500 mm or more | 203 | 97 |
| 700 mm or more | 26 | 12 |
| 900 mm or more | 6 | 4 |
| 1,000 mm or more | 0 | 0 |
All six cell-days of 900 mm or more are in Meghalaya, on four days: 6 July 1982, 3 and 4 August 1982 and 17 June 2022. The 1982 days come close to the 2022 record: 938 mm on 6 July and 939 mm on 4 August 1982, in the same cell.
Grouped into events, there are 86 separate events of 500 mm or more in the record, and 11 of 700 mm or more. These are the 11:
| Rank | Wettest cell, mm | Date (24 h to 8:30 am) | District | State |
|---|---|---|---|---|
| 1 | 979 | 17 June 2022 | South West Khasi Hills | Meghalaya |
| 2 | 939 | 4 August 1982 | South West Khasi Hills | Meghalaya |
| 3 | 938 | 6 July 1982 | South West Khasi Hills | Meghalaya |
| 4 | 822 | 15 June 1995 | South West Khasi Hills | Meghalaya |
| 5 | 779 | 15 June 2022 | East Khasi Hills | Meghalaya |
| 6 | 748 | 22 July 1991 | Purba Medinipur | West Bengal |
| 7 | 733 | 27 July 2005 | Mumbai Suburban | Maharashtra |
| 8 | 725 | 8 July 1984 | East Khasi Hills | Meghalaya |
| 9 | 718 | 22 June 1983 | Rajkot | Gujarat |
| 10 | 713 | 11 August 1987 | East Khasi Hills | Meghalaya |
| 11 | 711 | 8 July 2014 | South West Khasi Hills | Meghalaya |
Eight of the eleven are in the Khasi Hills. Only three events outside Meghalaya make the list: the Bengal coast in 1991, the Mumbai belt in 2005 and Saurashtra in 1983. The next one outside Meghalaya, just below the cut at 689 mm, is Thoothukudi in December 2023.
Where do India's wettest days fall?
Overwhelmingly, in the hills of Meghalaya. They hold 130 of the 203 cell-days of 500 mm or more (64%) and 46 of the 86 events. The steep southern face of the Khasi and Garo Hills rises straight out of the plains of Bangladesh, in the path of the monsoon winds from the Bay of Bengal, and the wettest cells sit along that slope.
Outside Meghalaya, the wettest grid days fall in a handful of settings:
- The west coast in the monsoon. The Konkan, with Mumbai's 733 mm on 27 July 2005, and the coasts of Goa and Karnataka.
- Monsoon days inland and on the Bengal coast. Saurashtra (718 mm in Rajkot in June 1983), central India (Korba in Chhattisgarh, 648 mm in July 1988; Dewas in Madhya Pradesh, 613 mm in August 2006) and Purba Medinipur on the Bengal coast (748 mm in July 1991).
- Cyclones and their remnants. On the east coast, the wettest cell in Prakasam district, Andhra Pradesh, received 495 mm in the 24 hours to 8:30 am on 21 May 2010, after Severe Cyclonic Storm Laila crossed the coast near Bapatla late on 20 May; IMD's gauge at Addanki recorded 52 cm that day [8]. In June 2023 the remnant of Cyclone Biparjoy, by then a depression over Rajasthan, gave a cell in Jalor district 446 mm on 18 June [9], in a desert district that averages 444 mm in a whole year.
- The northeast monsoon. In December 2023, an exceptionally heavy spell over southern Tamil Nadu gave a grid cell in Thoothukudi 689 mm, while IMD's gauge at Kayalpattinam recorded 95 cm [10].
- The Himalayan foothills. Uttarakhand's wettest grid day, 663 mm in Champawat on 5 July 2005, spread over 13 cells of 300 mm or more. The foothills of Jalpaiguri in West Bengal reached 638 mm on 21 July 1993.
Which months bring the wettest days?
The four monsoon months, as expected, but not only them.
June to September account for 575 of the 695 events of 300 mm or more (83%), and July alone for 220. But May and October together add another 66, and every month of the year has had at least three. A 300 mm day in a month when nobody expects one finds people least prepared.
Have record days become more common?
This is where the grid gives a less dramatic answer than the headlines. We compared the same two 15-year periods as our heavy rain case study, 1979–1993 and 2009–2023, and tested every difference by shuffling whole years at random 20,000 times to see how often chance alone would produce a gap as large.
- Separate events of 300 mm or more fell from 282 in 1979–93 to 179 in 2009–23, in Meghalaya (79 to 55) and in the rest of India (203 to 124). A gap this large would arise by chance about twice in 1,000 shuffles.
- Events of 500 mm or more fell from 42 to 20 (about once in 100 shuffles).
- The total number of cell-days of 204.5 mm or more changed much less, from an average of 301 to 280 a year, a difference well within chance (about one shuffle in two).
- Each cell's own record day is spread evenly through time: 33% of cells set their record in 1979–93, 38% in 1994–2008 and 29% in 2009–23, again consistent with chance.
So on IMD's grid, the very wettest days have not become more common over the last 45 years, and the number of separate extreme events is lower now than in the 1980s. That is a result about this dataset, and we would not stretch it further, for two reasons.
First, the grid is only as good as the gauges behind it, and their number has changed. In the paper describing the dataset, the number of gauges with data varied from about 1,450 in 1901 to about 3,950 in 1991–94, and fell to about 1,900 a day in the last two or three years of that record [3]. A storm that falls between gauges is smoothed or missed, so a thinner network can produce fewer extreme cells without any change in the weather. The three quietest years in the whole record for events of 300 mm or more are 2011, 2012 and 2013, with 3, 3 and 8 events, against an average of about 15. Second, other studies using longer records and different definitions do find rising extremes. Roxy and colleagues found a threefold increase in widespread extreme rain events over central India between 1950 and 2015 [11].
It also fits our earlier finding: across India, heavy rain days are not rising everywhere, they are moving. The extreme tail of the record shows no national rise either. What it does show is how much depends on where the gauges are.
Each district's wettest day
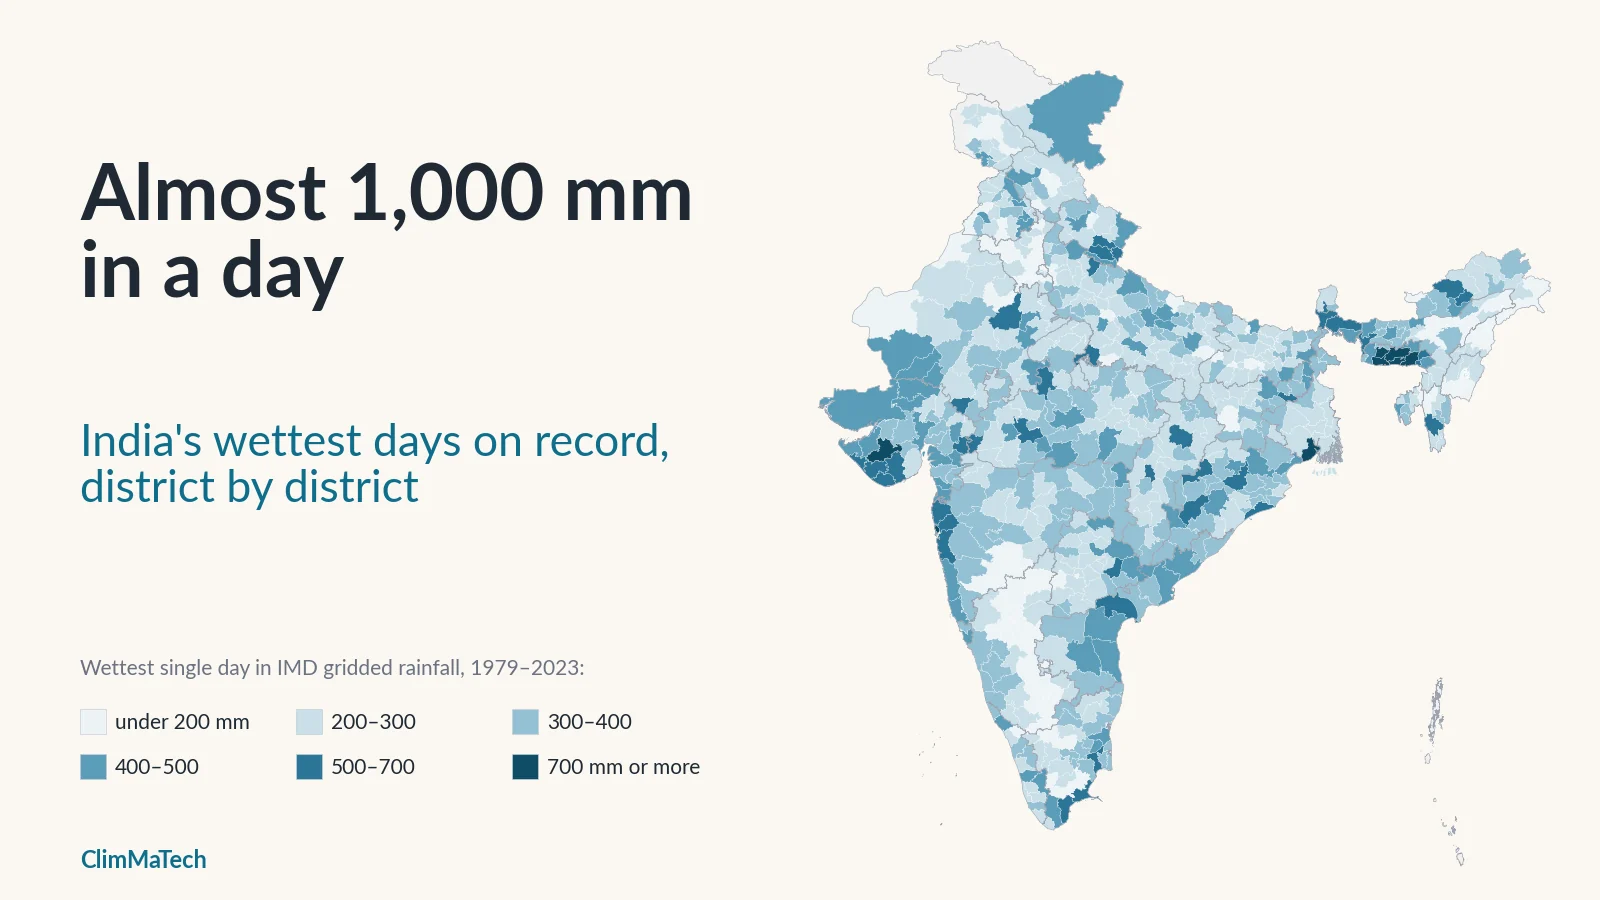
The map shows, for every district, the wettest single day in any grid cell centred in it. Switch the view to compare that day with a normal year at the same spot, or to see when it happened.
Across 688 districts:
- The median district's wettest day is 292 mm. In 589 districts it is 200 mm or more, in 317 it is 300 mm or more and in 47 it is 500 mm or more.
- In 440 districts, that single day brought more rain than the same spot normally receives in the whole month, and in 160 at least twice as much.
- In the median district, the wettest day equals about a quarter (26%) of a normal year's rain. In 363 districts it is a quarter or more, and in 65 districts it is half a normal year or more.
- In the year it happened, the record day delivered a median 18% of that year's rain, and in 162 districts a quarter or more.
- The records are not mostly recent. 275 districts set their record in 1979–93, 237 in 1994–2008 and 176 in 2009–23.
The dry districts are the most exposed to a single day
In absolute terms, the wettest districts have the wettest days. In relative terms, the opposite is true. In Meghalaya, even a 979 mm day is about a tenth of a normal year, because the hills get several metres of rain a year. In dry country, a single day can bring most of a year's rain in one go.
The districts where the wettest day reached half a normal year or more are concentrated in the west and north-west: 16 in Rajasthan, 14 in Gujarat, 9 in Punjab, 8 in Uttar Pradesh, and 4 each in Haryana and Andhra Pradesh.
- Jalor and Barmer, Rajasthan: the remnant of Cyclone Biparjoy gave Jalor 446 mm and Barmer 410 mm on 18 June 2023, about a normal year's rain in a day.
- Thoothukkudi, Tamil Nadu: 689 mm on 18 December 2023, 93% of a normal year and 5.4 times a normal December.
- Rajkot, Gujarat: 718 mm on 22 June 1983, 90% of a normal year.
- Kachchh (Kutch), Gujarat: 403 mm on 25 August 1990, three-quarters of a normal year.
This is the side of extreme rain that national rankings miss. A 400 mm day in Konkan is a bad monsoon day. A 400 mm day in Barmer arrives in a place whose drains, roads, embankments and farms are built for a year that brings little more than that.
Not every record in the grid is real
Some of the grid's extreme values are doubtful, and we flag them rather than hide them.
- Our neighbour check set aside 71 districts' highest raw values, because the cell stood alone. In Chhindwara, Madhya Pradesh, the grid holds 822 mm on 6 October 2001 in one cell, with no neighbouring cell above 242 mm. In Dhubri, Assam, it holds 796 mm on 23 September 1984. Our heavy rain case study quoted both as district records; under this test, Chhindwara's wettest supported day is 324 mm (14 August 2006) and Dhubri's 623 mm (20 September 1984). In Krishna, Andhra Pradesh, one cell holds 563 mm on 16 September 1994 while all eight neighbours were dry.
- Some supported values are also hard to believe. Faridkot and Muktsar in Punjab show 474 mm and 313 mm on 1 January 1995, where a normal January brings about 24 mm. Anugul, Kendujhar and Debagarh in Odisha show up to 597 mm on 5 March 1996, and Durg in Chhattisgarh 674 mm on 28 May 2016, both about 15 times the normal for the whole month. We found no record of any of these events. A single faulty gauge reading can spread over two or three neighbouring cells through the interpolation, and our check cannot catch that.
The map keeps these values and marks every district whose record is more than eight times its normal monthly rain, so that readers can judge for themselves. In Ladakh, very few gauges feed the grid at all, and its values there should be treated with caution.
The grid and the gauges: how far apart?
The most quoted extreme rain figures in India are gauge readings. The grid is something different: an estimate of the average rain over a cell of about 630–770 sq km, built from the nearest one to four gauges [3]. When we put famous events side by side, the gap is large, and it runs in both directions.
Event by event:
- Mumbai, 26–27 July 2005. The Santacruz observatory recorded 944 mm in the 24 hours ending at 8:30 am on 27 July, and the Vihar Lake gauge 1,049 mm. Colaba, about 27 km south, recorded only 74 mm [5]. Santacruz and Colaba fall in the same grid cell, which holds 492 mm. The wettest cell in the area, just to the north over Mumbai Suburban, holds 733 mm. On the grid, the city's worst day is real but blunted, and the 13-fold difference between two of its own gauges is invisible.
- Sohra, 17 June 2022. The gauge recorded 97 cm [1]. The cell containing Sohra holds 305 mm; the wettest cells, 891–979 mm, lie one to three cells to the west. IMD's gauge at Mawkyrwat, near those wettest cells, reported 54 cm the same morning [1]. The grid has the right storm in roughly the right place, but it does not put the peak where the gauges put it.
- Uttarakhand, 16–17 June 2013. Dehradun recorded 370 mm in the 24 hours to 8:30 am on 17 June [12], and the grid cell over the city 271 mm. Higher up, the Chorabari glacier camp above Kedarnath recorded 325 mm in the 24 hours to 5 pm on 16 June [13]. The grid cell containing Kedarnath holds 46 mm and 82 mm on 16 and 17 June. In fact, the grid's wettest day ever for Rudraprayag district, which includes Kedarnath, is 160 mm in August 2011: on the grid, the day of the Kedarnath disaster is not even the district's record.
- Chennai, 1–2 December 2015. City gauges recorded between 77 mm and 494 mm in the 24 hours to 8:30 am on 2 December, with an average of 286 mm [14]. The wettest grid cell around the city holds 381 mm.
- Kerala, 15–17 August 2018. Peerumedu recorded more than 800 mm over these three days and Idukki more than 700 mm [15]. The grid cell containing Peermade holds 557 mm over the same three days, and the wettest cell in Kerala 696 mm. No single grid day in Kerala in that week exceeded 295 mm. The 2018 floods were a disaster of several very wet days on full reservoirs, not of one record day, and the grid's district records in Idukki (417 mm, 1984) and Pathanamthitta (249 mm, 1992) are older.
- Himachal Pradesh, July 2023. In our study of these floods, stations in Kullu recorded up to 180 mm on 9 July [16]. The wettest grid cell in Kullu district holds 121 mm that day, and Kullu's grid record (187 mm, 1995) is older.
- Rajasthan, 18 June 2023. Here the grid is higher than the gauges. IMD's real-time bulletin listed Jalore at 32 cm, Chitalwana 34 cm and Mount Abu 36 cm [9], while the cell containing Jalore holds 446 mm. The grid may draw on gauges that the bulletin did not list, and from the published numbers alone we cannot say which is closer to the truth.
Why the gap? Three reasons, all of them about scale:
- A cell average is not a point. A grid cell over Mumbai covers most of the city. If 944 mm falls at Santacruz and 74 mm at Colaba, the honest average over the cell is somewhere in between.
- Interpolation smooths peaks. Each grid value is a weighted average of up to four nearby gauges. A peak recorded by one gauge is pulled down by its neighbours, and a peak that falls between gauges is never recorded at all.
- Gauges are few where the terrain is steep. In the hills of the Northeast, the Western Ghats and the Himalaya, rain changes over a few kilometres, and a single valley can hold the storm while the nearest gauges, and so the grid cell, miss most of it. Our explainer on weather radar, rain gauges and satellites covers what each kind of instrument can and cannot see.
None of this makes the grid wrong. It is the best long, consistent, national rainfall record India has, and it is the right tool for comparing districts and decades. But its wettest day is not a design storm for a culvert, and its record is not the most rain that has fallen on any particular village.
What it means
For design. Engineers use intensity–duration–frequency curves built from gauge records to size drains, culverts and bridges. The grid's district records are a useful screen of what a district has faced, but local design needs local gauge data, because a gauge can record two or three times the value of the grid cell it sits in, as at Santacruz and Sohra.
For dry districts. The most dangerous single days, relative to what a place is used to, fall in Rajasthan, Gujarat, Punjab and Tamil Nadu's dry south, not in the wettest places. A district that gets a year's rain in a day needs warnings and drainage plans as much as Konkan does, and usually has fewer of both.
For trends. On IMD's grid, India's very wettest days have not become more common since 1979. That should not be read as reassurance. A thinner gauge network can hide extremes, the heavy rain days that wear down infrastructure have shifted from one region to another, as our heavy rain case study showed, and spillways and drains designed from older records may not have the margin their designers intended (see our case study on ageing dams).
For cities and hills. Mumbai in 2005, Chennai in 2015, Kedarnath in 2013 and Himachal in 2023 were all bigger at the gauge than on the grid. The worst flooding happens at the scale of a ward, a valley or a catchment of a few dozen square kilometres, and a 25 km grid cannot see that scale.
What would help
- More gauges where rain is heaviest and gauges are fewest: the hills of the Northeast and the Western Ghats, the Himalayan valleys and the dry west, where a single storm can bring a year's rain. How many a district needs is the subject of our article on how many rain gauges a district needs.
- Rain recorded every few minutes, not once a day. A daily total says how much fell, not how fast. A 300 mm day that falls in three hours is a different flood from one spread over 24.
- Real-time reporting, so that the reading reaches a control room while the storm is still falling, not the next morning at 8:30 am.
- Open, quality-controlled station records, so that doubtful values like those above can be checked against the gauge that produced them, and real ones can be confirmed.
- Warnings that reach people in dry districts, where heavy rain is rare enough that nobody expects it.
Key points
- In 45 years of IMD's 0.25° gridded rainfall (1979–2023), the wettest day is 979 mm, in South West Khasi Hills, Meghalaya, on 17 June 2022. No grid cell has reached 1,000 mm; gauges have, with Sohra's reported 1,563.3 mm in June 1995.
- Days of 500 mm or more occurred on 97 days, in 203 cell-days; 64% of those cell-days and 46 of the 86 separate events were in Meghalaya.
- 83% of events of 300 mm or more fell between June and September, but May and October add 66 more.
- On the grid, the very wettest days have not become more common: separate events of 300 mm or more fell from 282 in 1979–93 to 179 in 2009–23, and district records are spread across all three periods. Changes in the gauge network behind the grid limit what this can say about the climate.
- In the median district, the wettest day equals about a quarter of a normal year's rain; in 65 districts, mostly in Rajasthan, Gujarat and Punjab, it is half a year or more.
- Gauges and the grid differ widely on the worst days: 944 mm at Santacruz against 492 mm in its cell, 97 cm at Sohra against 305 mm in its cell, and in Rajasthan in 2023 the grid above the gauges.
At ClimMaTech we work on the measurements this analysis shows are missing. VARSHAQ, our weather station in development, is designed to record rainfall where it falls and report it in real time. On rivers and streams, Tarang, a radar automatic water level recorder (AWLR), and PRAVAAH, both an AWLR and a surface velocity radar (SVR), which with a surveyed cross-section and a site-calibrated coefficient measures discharge without touching the water, show what that rain does downstream. Rakshak is a multi-hazard warning siren with 15–20 user-selectable siren tones and voice messages, for floods, other disasters and civil-defence warnings, to carry the alert to people who need it.
Method
Data. IMD 0.25° × 0.25° gridded daily rainfall [3][4], 1 January 1979 to 31 December 2023, 4,964 land cells. Each value is the rain of the 24 hours ending at 8:30 am IST on the date shown. IMD makes the data available for download from its Pune website and asks users who refer to it to cite Pai et al. (2014); it states that it cannot guarantee that the data are correct in all circumstances [4]. District boundaries are from the 2011 Census [7]; one polygon in northern Jammu and Kashmir that carries no district name in the boundary file was left out, leaving 688 districts.
Thresholds. 204.5 mm (IMD's extremely heavy rain [6]), 300, 500, 700, 900 and 1,000 mm in 24 hours.
Support check. A cell-day counts as supported if at least one of its eight neighbouring cells received at least half as much rain the same day (cells with no valid neighbour count as supported). All results here use supported cell-days only. Including unsupported values changes the counts only slightly (216 instead of 203 cell-days of 500 mm or more; 99 instead of 86 events) and none of the conclusions.
Events. Supported cell-days of 300 mm or more were grouped into one event when they were no more than one day and 1.5° of latitude or longitude apart. An event is credited to the state of its wettest cell.
Periods and tests. 1979–1993, 1994–2008 and 2009–2023. Differences between the first and last periods were tested by permutation: the 45 yearly values were shuffled 20,000 times and the p-value is the share of shuffles giving a difference at least as large (two-sided). The share of cells setting their record in each period was tested the same way (2,000 shuffles of whole years). Reported p-values: events of 300 mm or more 0.002; events of 500 mm or more 0.01; cell-days of 204.5 mm or more 0.54; record years 0.38.
District wettest day. The highest supported one-day value in any cell whose centre lies in the district; for 23 small districts with no cell centre inside, the cells touching the district. Its share of the year is that day divided by the same cell's total for the calendar year. Normal year and normal month are the same cell's 1979–2023 averages.
Gauge comparisons. Gauge values are as published by IMD or in peer-reviewed papers [1][5][8][9][10][12][13][14][15][16]; the grid value is that of the cell containing the gauge's approximate location on the same day, with the same 8:30 am convention. Multi-day comparisons use the sum of the same grid days.
Caveats. The number of gauges behind the grid changes from year to year, and gauges are sparse in the hills of the Northeast, the Himalaya and Ladakh, so values there depend heavily on interpolation. A grid value is an average over about 600–750 sq km and cannot represent the rain at a point. The support check removes isolated spikes but cannot catch an error that the interpolation spreads over several cells. Comparing 15-year periods shows change but does not, on its own, separate long-term trends from decadal variability or from changes in the network. Maps are approximate and not to scale.
References
- India Meteorological Department, Press release, 17 June 2022, 1300 IST (weather observed during the past 24 hours ending at 0830 IST; Annexure I), IMD, 2022. https://internal.imd.gov.in/press_release/20220617_pr_1678.pdf
- Press Trust of India, Another record for Cherrapunji, receives 972 mm rainfall in a day, The Tribune, 17 June 2022. https://www.tribuneindia.com/news/nation/another-record-for-cherrapunji-receives-972-mm-rainfall-in-a-day-404694
- Pai, D.S., Sridhar, L., Rajeevan, M., Sreejith, O.P., Satbhai, N.S. and Mukhopadhyay, B., Development of a new high spatial resolution (0.25° × 0.25°) long period (1901–2010) daily gridded rainfall data set over India and its comparison with existing data sets over the region, Mausam 65(1), 1–18, 2014. https://doi.org/10.54302/mausam.v65i1.851
- India Meteorological Department, Pune, High resolution (0.25 × 0.25 degree) gridded daily rainfall data (NetCDF), IMD. https://www.imdpune.gov.in/cmpg/Griddata/Rainfall_25_NetCDF.html
- Jenamani, R.K., Bhan, S.C. and Kalsi, S.R., Observational/forecasting aspects of the meteorological event that caused a record highest rainfall in Mumbai, Current Science 90(10), 1344–1362, 2006. https://www.currentscience.ac.in/Volumes/90/10/1344.pdf
- India Meteorological Department, National Bulletin No. 15, 11 September 2024 (rainfall intensity terms: heavy 64.5–115.5 mm, very heavy 115.6–204.4 mm, extremely heavy 204.5 mm or more), IMD, 2024. https://rsmcnewdelhi.imd.gov.in/uploads/archive/1/1_0cbf6a_15.National%20Bulletin%20No%2015-11th%20Sept2024_0830%20IST.pdf
- Office of the Registrar General and Census Commissioner, India, Census of India 2011: census tables, Ministry of Home Affairs, 2011. https://censusindia.gov.in/census.website/data/census-tables
- India Meteorological Department, RSMC Tropical Cyclones New Delhi, Report on cyclonic disturbances over north Indian Ocean during 2010 (Severe Cyclonic Storm Laila, 17–21 May 2010), IMD, 2011. https://rsmcnewdelhi.imd.gov.in/uploads/report/27/27_7aaf4d_rsmc-2010.pdf
- India Meteorological Department, RSMC New Delhi, National Bulletin No. 93, 18 June 2023: Depression (remnant of Cyclonic Storm 'Biparjoy') over Rajasthan, IMD, 2023. https://rsmcnewdelhi.imd.gov.in/uploads/archive/1/1_210bc5_93.%20National%20Bulletin%2020230618_0300.pdf
- India Meteorological Department, Press release, 18 December 2023, 1200 IST (exceptionally heavy rainfall over Thoothukudi and Tirunelveli districts; Annexure I), IMD, 2023. https://internal.imd.gov.in/press_release/20231218_pr_2696.pdf
- Roxy, M.K., Ghosh, S., Pathak, A., Athulya, R., Mujumdar, M., Murtugudde, R., Terray, P. and Rajeevan, M., A threefold rise in widespread extreme rain events over central India, Nature Communications 8, 708, 2017. https://doi.org/10.1038/s41467-017-00744-9
- India Meteorological Department, A report on heavy rainfall over Uttarakhand during 16–18 June 2013 (draft report), IMD, New Delhi, July 2013. https://www.emc.ncep.noaa.gov/monsoondesk/ppts/ndisasters/UK_Disaster.pdf
- Dobhal, D.P., Gupta, A.K., Mehta, M. and Khandelwal, D.D., Kedarnath disaster: facts and plausible causes, Current Science 105(2), 171–174, 2013. https://www.currentscience.ac.in/Volumes/105/02/0171.pdf
- World Weather Attribution, Chennai floods, December 2015, 2015; published as van Oldenborgh, G.J., Otto, F.E.L., Haustein, K. and AchutaRao, K., The heavy precipitation event of December 2015 in Chennai, India, Bulletin of the American Meteorological Society 97(12), S87–S91, 2016. https://www.worldweatherattribution.org/?p=766 ; https://doi.org/10.1175/BAMS-D-16-0129.1
- Sudheer, K.P., Bhallamudi, S.M., Narasimhan, B., Thomas, J., Bindhu, V.M., Vema, V. and Kurian, C., Role of dams on the floods of August 2018 in Periyar River Basin, Kerala, Current Science 116(5), 780–794, 2019. https://www.currentscience.ac.in/Volumes/116/05/0780.pdf
- Gupta, V., Syed, B., Pathania, A., Raaj, S., Nanda, A., Awasthi, S. and Shukla, D.P., Hydrometeorological analysis of July-2023 floods in Himachal Pradesh, India, Natural Hazards 120(8), 7549–7574, 2024. https://doi.org/10.1007/s11069-024-06520-5
Data credits: rainfall data from the India Meteorological Department; district boundaries from the Census of India 2011. Analysis, map and charts: ClimMaTech.