
India's dams are getting old. Who is watching downstream?
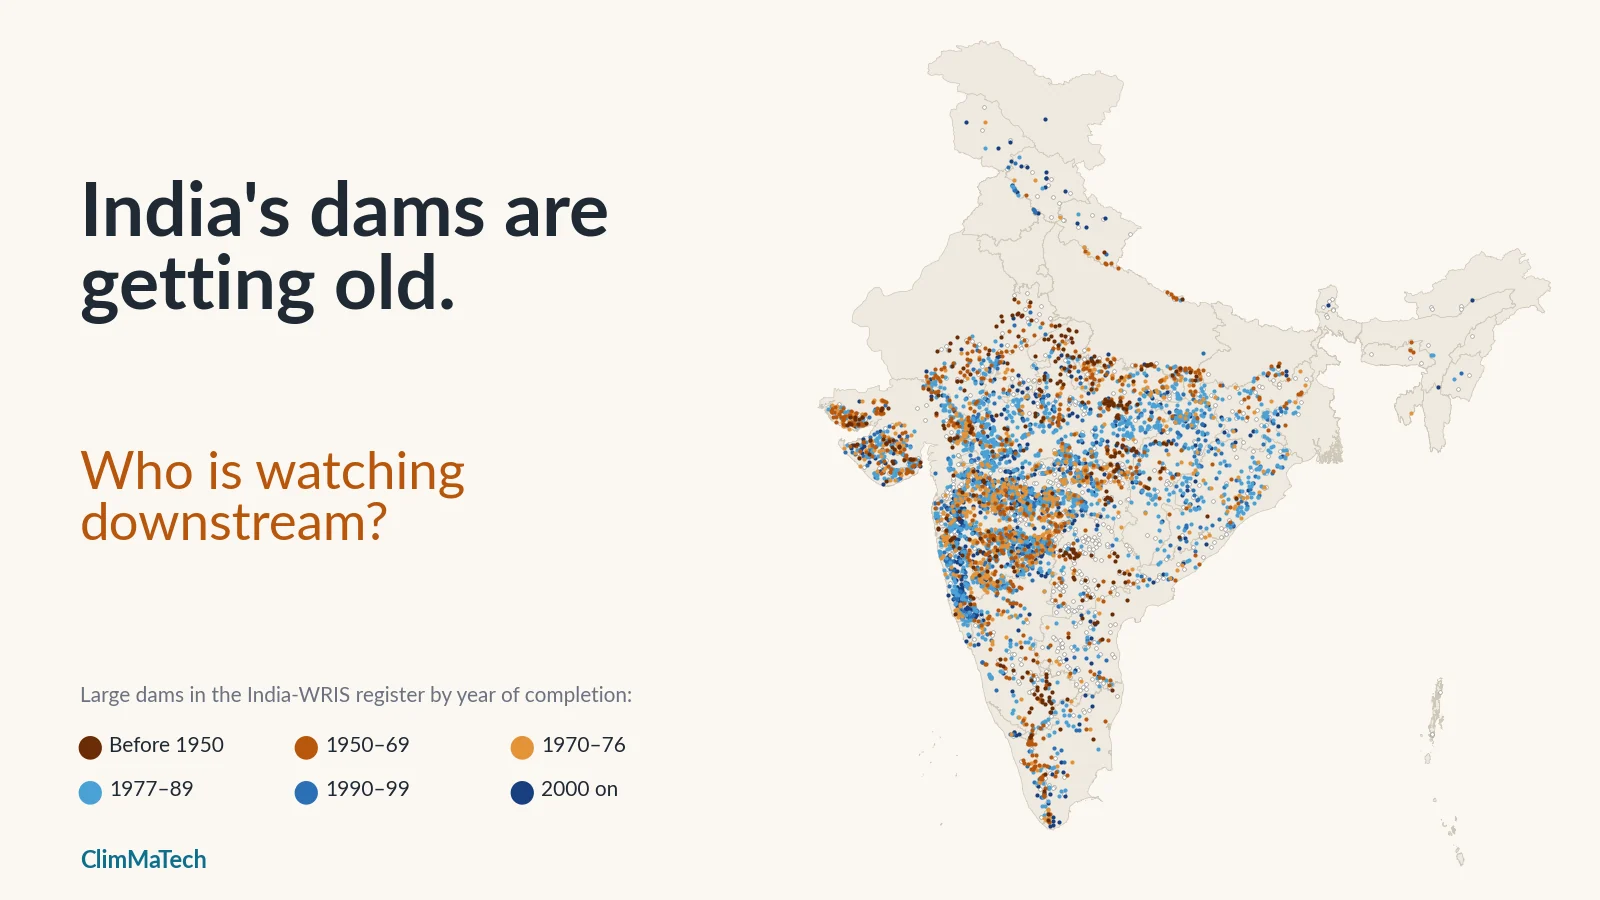
A building boom from the 1970s and 80s is turning 50, so we mapped India's large dams by age, earthquake zone and the change in heavy rain since they were built, and asked what the people downstream can rely on.

On 11 August 1979, after intense monsoon storms over Gujarat, water rose over the earthen embankments on both sides of the spillway of the Machchhu II dam, and the dam failed. The flood wave went on through the town of Morbi below. Nobody knows exactly how many people died; estimates range from about 1,800 to as many as 25,000 [1].
Two facts about Machchhu II are worth keeping in mind for the rest of this article. First, the dam was new: it had been completed in 1972 [1]. Dams do not have to be old to fail. Second, its spillway had been built to pass about 5,700 m³/s (200,000 cubic feet per second), and a later engineering review estimated that the flood peak reached about 13,000 m³/s (460,000 cfs), more than twice that [1]. The designers had used the flood record they had. The flood that came was bigger.
Forty-seven years later, both points matter again. India's dams are no longer new, and in Morbi district itself, as our case study on heavy rain showed, the number of heavy rain days a year has risen by almost 90% in a generation.
This case study asks three questions of the national dam data:
- How old are India's large dams, and how fast is that changing?
- How many of the old ones are in districts where heavy rain has become more common?
- How many of those are also in the country's highest earthquake zones?
We set out with a fourth question, the one that matters most to people living below a dam: how many dams are watched in real time? The dam register cannot answer it, because it has no field for monitoring. We come back to it at the end, using what the government has reported.
How old are India's dams?
About one in four of India's large dams is more than 50 years old. The National Register of Specified Dams (NRSD) 2025, compiled by the National Dam Safety Authority (NDSA), lists 6,628 specified dams, of which 6,545 are operational and 83 under construction. Of these, 1,681 dams (about 26%) are more than 50 years old and 291 are more than 100 years old; another 42% or so are between 25 and 50 [2][3]. A "specified dam" under the Dam Safety Act, 2021 is one more than 15 m high, or 10–15 m high if it meets prescribed technical criteria [2]. The NDSA released a newer edition, the NRSD 2026, in May 2026 [4]; the age figures above are the latest the government has published in summary.
The official register does not come as a map with rainfall attached, so for the analysis below we used the dam layer published on India-WRIS, the Ministry of Jal Shakti's water resources information system [5]. It lists 5,619 large dams with their location, state, district, river, type, seismic zone and year of completion. It is an older and smaller snapshot than the NRSD: its most recent completion year is 2017, and 936 of its dams have no completion year at all. That leaves 4,683 dams with a usable year.
Throughout, a dam's age means 2026 minus the completion year recorded for it, and we call a dam old if it was completed in 1976 or earlier, so that it reaches 50 this year. On that basis 1,694 dams in the WRIS layer are old, very close to the NRSD's 1,681. They are 36% of the dams with a known year (30% of all 5,619), a higher share than the NRSD's 26% because the WRIS layer misses many of the dams built in the last two decades.
Fifty years is not an expiry date. A well-built and well-maintained dam can serve for much longer. But it is a widely used marker. The United Nations University's 2021 review of ageing water storage notes that by about 50 years a large concrete dam would most probably begin to show signs of ageing, and it projected that more than 1,115 large dams in India would be roughly 50 years old in 2025 [6].
The building boom is turning 50
India built most of its dams in one generation. A few hundred in the register were completed before Independence, some of them centuries old. Construction picked up in the 1950s, accelerated through the 1960s and peaked between the mid-1970s and mid-1980s: 168 dams in the register were completed in 1983 alone, 157 in 1980 and 152 in 1978. The 1970s added 1,140 dams and the 1980s another 1,294. After 1990 the pace slowed sharply.
Half of the dated dams were completed between 1972 and 1991, and the median completion year is 1981. The median dam is 45 years old.
That shape means India's dams do not age gradually. They age as a cohort, and the bulge of the 1970s and 80s is crossing the 50-year line now.
On the register's dates:
- 2026: 1,694 dams are 50 or older.
- 2035: 2,978 will be, an increase of about 1,300 (76%) in nine years.
- 2045: 3,813, more than four in five of the dated dams.
- 357 dams are already 75 or older, and 243 have passed 100.
Dams built after 1985 cannot reach 50 by 2035, so the dams missing from the WRIS layer barely change the 2035 figure. The 936 undated dams can only add to it.
What "age" means in a dam register
A completion year is a simple field, and it hides three different things.
- Historic structures. Thonnur in Mandya district, Karnataka, is recorded with a completion year of 1000. Swaroop Sagar (1560) and Udai Sagar (1585) in Udaipur and Rajsamand (1676) in Rajasthan are historic lakes later classified as large dams, and they have been repaired many times.
- Rebuilt dams. The register gives Machchhu II a completion year of 1989, because the dam that failed in 1979 was rebuilt, with a spillway about four times larger, and completed in 1989 [1]. Panshet near Pune, which gave way on 12 July 1961 and flooded the city [7], is recorded as completed in 1972. A rebuilt dam looks young in the register.
- Missing years. 936 dams have no year. Maharashtra alone has 320 of them, Telangana 109 and Andhra Pradesh 80. They are probably a mix of old and recent dams, so every count of old dams here is a lower bound.
And age is not condition. The register says nothing about inspections, repairs or instruments. An old dam that has been inspected and rehabilitated can be in better shape than a newer one that has not. Nothing in this article is an assessment of any individual dam's safety.
What ages in an earthen dam?
Most Indian dams are earthen embankments. In the WRIS layer, 4,748 of the 5,619 dams (85%) are recorded as earthen (type TE), and another 446 combine an earth embankment with a concrete or masonry section. Only 186 are concrete or masonry gravity dams. Old dams are no different: about 96% of the old dams with a recorded type have an earthen component.
Earthen dams are economical and suit much of India's geology. Their ageing is slow and mostly invisible: seepage that can carry fine soil out of the embankment or its foundation, gates and hoists that corrode or seize, and reservoirs that fill with silt. Across 439 reservoirs analysed by the Central Water Commission (CWC), with an average age of 42 years, about 19% of the original gross storage has been lost to sediment, roughly 0.74% a year [2]. Every lost cubic metre of storage is a cubic metre that cannot absorb a flood (see why Indian reservoirs lose storage).
The failure that matters most for this article is overtopping. An earth embankment is not built to have water flow over its crest, and once it does, the embankment can erode away. That is what happened at Machchhu II [1]. Whether that happens depends on whether the spillway and gates can pass the flood that actually arrives.
A spillway is sized for the rain its designers knew
Engineers size a dam's spillway to pass a design flood, estimated from the rainfall and river records available when the dam was designed (our explainer on how dam spillways and gates work covers the mechanics). For a dam completed in 1970, those records might have covered two or three decades, often from a handful of rain gauges. The design was a reasonable judgement about the rainfall of its time, and the dam carries that judgement for its whole life.
Our case study on heavy rain used the India Meteorological Department's (IMD) 0.25° gridded daily rainfall for 1979–2023 [8]. It counted heavy rain days, days with 64.5 mm or more of rain, IMD's "heavy rain" threshold, and compared 1979–93 with 2009–23. Nationally the average barely moved, from 2.15 to 2.18 heavy rain days a year. But the map split: 120 districts gained at least half a heavy rain day a year and 140 lost at least that much. The gains run down the west coast, through Saurashtra and Kutch, across central India and Odisha and into the Uttarakhand hills, while the Gangetic plain and much of the Northeast lost heavy rain days.
A dam's catchment can extend well beyond its district, and a district average is not a design storm. But where heavy rain days have risen by half or more, a spillway designed from the older record may have less margin than its designers intended. The Dam Safety Act, 2021 already requires a mandatory review of design floods as part of every comprehensive dam safety evaluation [9]. The question this analysis can help with is where to look first.
Where are old dams meeting more heavy rain?
We placed every dam in its 2011 Census district by its coordinates and gave it that district's change in heavy rain days.
383 of the 1,694 old dams are in districts where heavy rain days rose by at least half a day a year. They lie in 58 districts. 78 of them are in districts where heavy rain rose by a full day a year or more. On the register's dates, the number of old dams in these rising-rain districts will reach 699 by 2035.
Two states hold almost three quarters of them: Gujarat (174) and Maharashtra (105).
It is worth being clear about what this does not show. Old dams are not concentrated in rising-rain districts: 34% of the dated dams in those districts are old, against 37% in all other districts. Nobody built old dams in the wrong places. The rain moved, and in some districts it moved onto a lot of old dams.
The districts with the most old dams where heavy rain is rising:
| District | Old dams in the district | Median completion year | Heavy rain days a year, 1979–93 → 2009–23 |
|---|---|---|---|
| Kachchh, Gujarat | 92 | 1961 | 1.1 → 1.7 (+55%) |
| Nashik, Maharashtra | 38 | 1973 | 2.1 → 2.8 (+37%) |
| Pune, Maharashtra | 24 | 1956 | 2.8 → 3.4 (+23%) |
| Rajkot, Gujarat | 24 | 1964 | 1.6 → 2.5 (+53%) |
| Raigad, Maharashtra | 14 | 1973 | 11.5 → 13.4 (+17%) |
| Amreli, Gujarat | 12 | 1962 | 1.4 → 2.1 (+46%) |
| Jamnagar, Gujarat | 11 | 1963 | 1.6 → 2.8 (+77%) |
| Morbi, Gujarat | 9 | 1972 | 1.0 → 1.9 (+87%) |
| Sindhudurg, Maharashtra | 9 | 1974 | 12.2 → 12.7 (+4%) |
| Idukki, Kerala | 8 | 1960 | 2.3 → 3.5 (+54%) |
| Devbhumi Dwarka, Gujarat | 6 | 1953 | 1.7 → 3.5 (+102%) |
| Palghar, Maharashtra | 6 | 1973 | 7.9 → 11.4 (+43%) |
| Thane, Maharashtra | 6 | 1963 | 7.5 → 10.4 (+38%) |
Kutch and Saurashtra. Kachchh is an arid district: it received about 380 mm of rain a year in 1979–93. Most of its 92 old dams are small earthen dams on seasonal rivers, built to catch rare rain. Heavy rain is now noticeably less rare. Next door in Saurashtra, Jamnagar, Morbi and Devbhumi Dwarka have seen some of the largest relative rises in India; Dwarka's heavy rain days doubled. Rajkot's old dams include two of the oldest in any rising-rain district, Revania and Panelia, both recorded as completed in 1882.
The Konkan and Mumbai. Here the percentages look modest because these are already among the wettest districts in India, but the absolute gains are the largest of any district holding old dams: about 3.4 more heavy rain days a year in Palghar, 3.1 in Mumbai Suburban and 2.9 in Thane. These districts hold some of the oldest dams on Mumbai's water supply: Vihar (1860) and Tulshi (1879) in Mumbai Suburban, Tansa (1892) and Lower Vaitarna (1954) in Thane.
Nashik and Pune. These two districts inland of the Konkan hold 62 old dams between them in rising-rain areas. Pune's include Khadakwasla, recorded as completed in 1880.
Idukki. Heavy rain days in Idukki rose by about half. The district holds the Periyar dam, better known as Mullaperiyar, completed in 1895, as well as the Idukki arch dam (1974) and Cheruthoni (1976).
Smaller clusters appear in Odisha (Nayagarh and Ganjam), Chhattisgarh (Raipur), Karnataka (Shimoga), Tamil Nadu (Kanniyakumari), Rajasthan (Banswara) and Uttarakhand (Udham Singh Nagar and Nainital).
Explore the map
Every dam in the WRIS layer, coloured by period of completion. Filter by age or state, show only dams where heavy rain is rising or only those in seismic zones IV and V, and tap a dam to see what the register records about it. The shading shows the change in heavy rain days by district from our earlier case study.
Which old dams sit in high earthquake zones?
The register records each dam's seismic zone under the Bureau of Indian Standards' earthquake code, IS 1893 (Part 1), whose zone map runs from zone II (lowest hazard) to zone V (highest) [10]. Most dams are in the lower zones: 2,710 in zone II and 2,343 in zone III. 350 are in zone IV and 170 in zone V. Of the 1,694 old dams, 169 are in zone IV or V, 98 of them in zone V.
Earthquakes and floods are independent hazards, but a dam has to survive both, and earthquake damage to an embankment can stay hidden until the next flood tests it. The Bhuj earthquake of 26 January 2001 damaged a large number of small and medium earth dams near its epicentre in Kutch. A study of six of them found severe slumping at Chang dam and severe damage at Shivlakha, Suvi and Tapar, and noted that the damage was limited only because the earthquake struck in the dry season, when the reservoirs were nearly empty; otherwise liquefaction of the foundation soils would have been more extensive [11].
Combine all three conditions, an old dam, in a district where heavy rain is rising, in seismic zone IV or V, and the register gives 133 dams:
- Gujarat, 117: Kachchh 92, Jamnagar 7, Morbi 7, Devbhumi Dwarka 5, Rajkot 4, Junagadh 1 and Porbandar 1. Chang, Shivlakha, Suvi and Kaswati, four of the dams examined after the Bhuj earthquake, are on the list.
- Maharashtra, 8: four each in Raigad and Ratnagiri.
- Uttarakhand, 7: six in Udham Singh Nagar and Bhimtal (1883) in Nainital.
- Himachal Pradesh, 1: Bhakra (1963), which our district boundaries place in Una district.
A dam on this list is not a dam about to fail. Three coarse factors from public data cannot say that, and some of these dams are already being worked on: Bhakra, for example, is among the dams planned for safety improvement under the Dam Rehabilitation and Improvement Project [2]. But if a state had to decide where to review design floods and earthquake safety first, this is a reasonable shortlist, and anyone can reproduce it from public data.
What about Himalayan dams?
Himachal Pradesh, where we are based, shows the limits of this kind of analysis. The WRIS layer lists 22 dams in the state, almost all for hydropower. Most are young: Chamera I dates from 1994 and Nathpa Jhakri from 2008, and nine have no completion year. Only Bhakra (1963), Bassi (1970) and Pong (1974) are past 50.
On the 25 km rainfall grid, heavy rain days are flat or falling in most of the state's dam districts. As our heavy rain case study explained, that grid cannot see the cloudbursts that do most of the damage in the hills. In narrow Himalayan valleys the threat to a dam and to the people below it is often a sudden flood carrying debris, or a glacial lake outburst flood (GLOF) that no rainfall record shows at all. On 3 October 2023 a moraine collapse into South Lhonak Lake in Sikkim set off an outburst flood down the Teesta that destroyed the concrete dam of the Teesta III hydropower project [12]. For Himalayan dams, the downstream question is above all one of warning time (see how GLOFs are watched).
Who is watching downstream?
Our article on what the Dam Safety Act asks of dam owners and districts explains the law in full. The provisions that bear directly on the people downstream are these. Every owner of a specified dam must [9]:
- inspect each dam before and after every monsoon, and during and after any flood or earthquake (section 31);
- set up a hydro-meteorological station near each dam (section 33);
- establish a hydro-meteorological network and inflow forecasting system, and an emergency flood warning system for the areas likely to be flooded downstream, and give the district authorities information on expected inflows and outflows (section 35);
- prepare an emergency action plan for each dam, and for dams that existed when the Act came into force, do so within five years (section 36);
- carry out a comprehensive dam safety evaluation by an independent panel, including a mandatory review of design floods, the first within five years for existing dams (section 38).
The Act came into force on 30 December 2021 [2], so the five-year deadlines for existing dams fall at the end of December 2026.
Progress is real, and the gap is large:
- Inspections are happening. Dam owners reported pre-monsoon inspections of about 6,524 dams and post-monsoon inspections of about 6,553 in 2025. Those inspections placed three dams in Category I (the most serious deficiencies) and 216 in Category II (major deficiencies needing prompt remedial measures), 69 of which are more than 50 years old [3].
- Emergency action plans lag. On 3 August 2026 the Minister of Jal Shakti told the Rajya Sabha that emergency action plans had been prepared and updated for 735 of the 6,598 completed and operational specified dams as of 30 July 2026, about one in nine. Maharashtra, with 2,713 specified dams, had 65; Gujarat had 39 for 524 [13].
- Rehabilitation is targeted. The Dam Rehabilitation and Improvement Project (DRIP) Phases II and III, co-financed by the World Bank and the Asian Infrastructure Investment Bank, cover 736 dams in 19 states and three central agencies over 2021–2031, with an outlay of ₹10,211 crore. By 31 December 2025, rehabilitation proposals for 173 dams had been approved and major works were complete at 35 [3].
- Real-time storage data covers the largest reservoirs. The CWC monitors the live storage of 166 reservoirs. A telemetry-based monitoring system was installed on 78 major reservoirs, but because of problems with the satellite technology the data is now entered by project authorities and CWC offices into a web portal [14].
Set those numbers against the cohort. About 1,300 more dams will pass 50 by 2035. Several hundred of the old ones are in districts where heavy rain has become more common since they were built. An inspection in March cannot see a flood in August. On the night it matters, the safety of the people downstream depends on three things: knowing how much rain is falling on the catchment now, knowing how fast the reservoir and the river below are rising, and getting that to the people who must act in time. The register cannot tell us how many dams have that today, and no public national count exists.
What would help
None of this calls for alarm, and none of it calls for new dams. It calls for knowing more, sooner, about the dams we have.
- Complete the public register. 936 dams in the WRIS layer have no completion year. A register is the first tool of a safety programme; the NRSD and its public map layers should agree, with completion years and any later reconstruction recorded separately.
- Use recent rainfall to set priorities. The design-flood reviews the Act requires can start where old dams meet rising heavy rain. The 383 old dams in rising-rain districts, and the 133 of those in seismic zones IV and V, are one reasonable place to begin.
- Measure continuously at the dam and below it. Section 35 of the Act already asks for hydro-meteorological networks, inflow forecasting and downstream flood warning. Reservoir level, catchment rainfall and river level downstream, recorded every few minutes rather than read by eye once or twice a day, are what make inflow forecasts and gate decisions possible.
- Connect the dam to the people below it. An emergency action plan only helps if it is triggered in time, with alerts that reach villages and towns downstream through sirens, phones and voice messages in the local language.
- Make the data public. Real-time reservoir levels, gate operations and release warnings, visible to district administrations and the public, let everyone downstream see what the dam is doing.
Key points
- About one in four of India's 6,628 specified dams is more than 50 years old (NRSD 2025), and the 1970s–80s building boom is crossing 50 now: on the WRIS register's dates, dams aged 50 or more rise from about 1,700 in 2026 to about 3,000 by 2035.
- A completion year can be a rebuild or a historic origin, and 936 dams in the WRIS layer have none. Age is not condition.
- 383 old dams are in districts where heavy rain days have risen by at least half a day a year since 1979–93, almost three quarters of them in Gujarat and Maharashtra; 133 of those are also in seismic zone IV or V, mostly in Kutch and Saurashtra.
- The Dam Safety Act requires design-flood reviews, emergency action plans, hydro-meteorological networks and downstream flood warning for every specified dam, with first deadlines for existing dams at the end of 2026; in July 2026 about one dam in nine had an updated emergency action plan.
At ClimMaTech we build the field instruments for this kind of monitoring. Tarang is a radar automatic water level recorder (AWLR) for reservoirs and rivers, PRAVAAH is both an AWLR and a surface velocity radar (SVR) and, with a surveyed cross-section and a site-calibrated coefficient, measures river discharge below a dam without touching the water, and Rakshak is a multi-hazard warning siren, with 15–20 user-selectable siren tones and voice messages, that carries flood alerts, warnings for other disasters and civil-defence signals to the people downstream. Our dam and reservoir solution shows how they fit together.
Method
Dams. India-WRIS dam layer (5,619 large dams; fields include location, district, state, river, dam type, completion year and seismic zone), published by the Ministry of Jal Shakti [5]. 4,683 dams have a usable completion year; 933 have none, two are marked "under construction" and one record with a year of 15 was treated as missing. Age = 2026 minus completion year. "Old" = completed in 1976 or earlier. The layer's latest completion year is 2017. Official totals and age counts are from the NRSD 2025 as reported by the government [2][3].
Rainfall. IMD 0.25° gridded daily rainfall, 1979–2023 [8]. For each district (2011 Census boundaries), the mean annual number of days with 64.5 mm or more over all grid cells touching the district, 2009–2023 against 1979–1993, exactly as in our heavy rain case study. "Rising" = an increase of at least 0.5 days a year; "sharply rising" = at least 1.0 day a year. 120 districts are rising, 40 of them sharply.
Joining. Each dam was placed in a district by its coordinates; 5,616 of the 5,619 fall in a district with a rainfall result. Seismic zones are as recorded in the dam layer.
Caveats. The WRIS layer is older and smaller than the NRSD, and the counts of old dams are lower bounds. Completion years may describe a reconstruction or a historic origin. A district average does not describe the rainfall over any dam's catchment, which may extend into other districts, and a 25 km grid cannot resolve local cloudbursts. Comparing two 15-year periods shows change but does not separate long-term trends from decadal variability. The register contains no information on condition, inspection or instruments, so nothing here assesses any individual dam. Maps are approximate and not to scale.
References
- Association of State Dam Safety Officials. Machhu Dam II (Gujarat, India, 1979), dam failure case study. https://damfailures.org/case-study/machhu-dam-ii-gujarat-india-1979
- Press Information Bureau, Government of India. Dam Rehabilitation: Strengthening Infrastructure through Policy and Technology (backgrounder). Ministry of Jal Shakti, 15 May 2026. https://www.pib.gov.in/PressNoteDetails.aspx?NoteId=158621&ModuleId=3®=3&lang=1
- Press Information Bureau, Government of India. Status and safety of old dams (written reply in the Lok Sabha). Ministry of Jal Shakti, 29 January 2026. https://www.pib.gov.in/PressReleasePage.aspx?PRID=2220215®=3&lang=2
- Sarkaritel. NDSA holds dam safety workshop, launches DHARMA app and digital platforms. 28 May 2026. https://www.sarkaritel.com/?p=407771
- India-WRIS, Ministry of Jal Shakti. Dams (water resources projects layer). https://indiawris.gov.in/wris/
- United Nations University. Ageing dams pose growing threat (on Perera, D., Smakhtin, V., Williams, S., North, T. and Curry, A., Ageing Water Storage Infrastructure: An Emerging Global Risk, UNU-INWEH Report Series 11). UNU-INWEH, 22 January 2021. https://unu.edu/press-release/ageing-dams-pose-growing-threat
- Mahratta Chamber of Commerce, Industries and Agriculture. MCCIA and the 1961 Pune floods. https://www.mcciapune.com/media/Publication/Publication_File/MCCIA_and_the_1961_Pune_Floods.pdf
- Pai, D. S., Sridhar, L., Rajeevan, M., Sreejith, O. P., Satbhai, N. S. and Mukhopadhyay, B. Development of a new high spatial resolution (0.25° × 0.25°) long period (1901–2010) daily gridded rainfall data set over India and its comparison with existing data sets over the region. Mausam 65(1), 1–18, 2014. https://doi.org/10.54302/mausam.v65i1.851
- Government of India. The Dam Safety Act, 2021 (No. 41 of 2021). Gazette of India, 14 December 2021; copy published by the Central Water Commission. https://www.cwc.gov.in/sites/default/files/booklet.pdf
- Bureau of Indian Standards. IS 1893 (Part 1): 2002, Criteria for earthquake resistant design of structures, Part 1: General provisions and buildings. BIS, New Delhi, 2002 (archived copy, Public.Resource.Org). https://law.resource.org/pub/in/bis/S03/is.1893.1.2002.pdf
- Singh, R., Roy, D. and Jain, S. K. Analysis of earth dams affected by the 2001 Bhuj Earthquake. Engineering Geology 80, 282–291, 2005. https://doi.org/10.1016/j.enggeo.2005.06.002
- Sattar, A., Cook, K. L., Rai, S. K. and others. The Sikkim flood of October 2023: Drivers, causes, and impacts of a multihazard cascade. Science 387(6740), eads2659, 2025. https://doi.org/10.1126/science.ads2659 ; see also University of Zurich, Sikkim flood disaster, 2025. https://geo.uzh.ch/en/news/papers/2025/sikkim-flood-disaster.html
- Press Trust of India. Emergency action plans updated for 735 of 6,598 specified dams: Union Government. The Pioneer, 3 August 2026. https://dailypioneer.com/news/emergency-action-plans-updated-for-735-of-6598
- Press Information Bureau, Government of India. Reservoir storage monitoring system (written reply in the Lok Sabha). Ministry of Jal Shakti, 4 December 2025. https://www.pib.gov.in/PressReleseDetailm.aspx?PRID=2198929®=3&lang=2