
What is a debris flow? Effects on river monitoring
What the term means, how a debris flow differs from a flood, and why it breaks the assumptions behind ordinary stage and discharge measurement in Himalayan streams.

After a heavy storm in a Himalayan catchment, a stream that looked ordinary in the morning can send down a wall of boulders and mud within minutes. A gauge on a bridge may report a level, but is that level a flood or something else? The question behind the search debris flow meaning is practical: what is moving down the channel, and can our instruments be trusted while it does? This article defines the term, separates it from similar events, and explains what it does to water-level, velocity and discharge monitoring.
What is a debris flow? The meaning in plain terms
A debris flow is a very rapid to extremely rapid surging flow of saturated debris in a steep channel, with strong entrainment (pick-up) of material and water from the flow path. That is the formal definition in the widely used update of the Varnes landslide classification by Hungr, Leroueil and Picarelli [1]. In everyday words, it is a moving slurry of soil, boulders, tree trunks and water, much denser than river water, that scours the channel as it goes and arrives in pulses called surges.
Three features from that paper matter for monitoring [1]:
- Established paths. Debris flows occur repeatedly in gullies and first- or second-order drainage channels. The hazard belongs to a particular channel and its deposition area, the debris fan.
- Surges with steep fronts. A surge often has a front made of a boulder concentration or a turbulent "head". An event can be one surge or many.
- Very large peaks. The peak discharge of the largest surge in a debris flow event may be more than one order of magnitude greater than the most extreme water flood in the same channel [1].
Debris flow, debris flood and flash flood: what is the difference?
A debris flood is a very rapid flow of water heavily charged with debris in a steep channel, with a peak discharge comparable to that of a water flood [1]. A debris flow is something else: the slurry itself is the flow. Hungr and colleagues give two working tests for the largest surge of an event: either its peak discharge is more than three times that of a major flood flow, or the mean solids concentration at the surge peak is above about 60 % by volume and the water and solids are thoroughly mixed [1].
| Feature | Water flood | Debris flood | Debris flow |
|---|---|---|---|
| What moves | Water, normal sediment load | Water heavily charged with debris | Saturated debris, water and solids mixed |
| Peak discharge | Reference | Comparable to a flood; bulking up to about 2–3 times [1] | More than about 3 times a major flood [1] |
| Typical drainage | Any size | Can be large | Steep, usually less than a few square kilometres [1] |
| Impact forces | Low | Limited [1] | High; moves large boulders [1] |
"Flash flood" is a hydrological term for a rapid rise in a small catchment; a debris flow can be one of its forms. For the rainfall side of the picture, see cloudburst vs flash flood, and for slope failures that feed channels, landslide early warning systems in India.
Why Himalayan streams are prone to debris flows
Steep gullies, loose slope material, intense short rain and, higher up, ice and glacial lakes all supply the ingredients. Some Himalayan examples from the literature show the range:
- Leh, Ladakh, August 2010. Cloudbursts hit the Leh area on 4–6 August. The nearest rain station recorded only 12.8 mm in a day, which the authors say did not match the severity of the floods. Peak discharge estimates were about 122 m³/s (±35 %) for a 2.4 km² catchment and about 1,070 m³/s (±35 %) for a 65 km² one [2].
- Melamchi, Nepal, 2021. A survey-based assessment describes a debris flow and flood that caused over 25 deaths in Melamchi Bazaar and heavily damaged a water supply project, with estimated losses of USD 436 million in Melamchi municipality alone [3].
- Chamoli, Uttarakhand, 7 February 2021. About 27 million m³ of rock and glacier ice collapsed from Ronti Peak and became an extraordinarily mobile debris flow, carrying boulders over 20 m across, scouring valley walls up to 220 m above the valley floor, and severely damaging two hydropower projects. More than 200 people were killed or missing [4].
- Glacial lakes. ICIMOD describes glacial lakes in the Himalaya as inherently unstable, with outburst floods endangering people and property downstream [5]. Hungr and colleagues note that outburst floods from such lakes have caused serious damage in glaciated mountains of Nepal and can attain the character of true debris flows in their largest surges [1]. See also glacial lake outburst floods.
The common thread is a small, steep source area and very little time; see river monitoring in hill and Himalayan catchments.
How do debris flows behave in a channel?
A debris flow is not a steady rise. Hungr and colleagues cite a record from a mountain torrent in the Austrian Alps where 11 surges, each above 50 m³/s, passed in an 8-minute period, one briefly reaching 370 m³/s [1]. That is one surge about every 44 seconds on average (8 × 60 s ÷ 11).
Measured velocities are high. In a study at Alpine channels, seismic sensors placed along the channel gave front velocities of about 3.5–4.7 m/s for a 1.3 m high front at one site, rising to about 9–10 m/s when the flow depth exceeded 3.5 m; a Doppler radar at that site recorded a peak of 10.0 m/s [6]. Those authors estimate velocity from the time a seismic signal takes to travel between two sensors 75–280 m apart, depending on the site, and note that the longest spacing (280 m) made it hard to capture the same surge at both sensors [6].
The review by Hürlimann and colleagues of nine monitoring sites adds that most of the catchments are under about 10 km², that hourly rainfall of 5–15 mm is enough to trigger flows at many sites, and that sensors fall into two groups: those that watch the triggers (rain, soil moisture, pore-water pressure) and those that watch the flow (stage, ground vibration, video) [7].
What a debris flow does to monitoring
This section is our own reasoning from the physics above; the first two points follow directly from the definitions in [1].
1. The rating curve stops applying. A rating curve converts stage to discharge for clear-water flow in a stable section (see rating curves and their uncertainty). In a debris flow the density, velocity and roughness are different, and the section itself is being scoured or filled. A stage reading may still be a true depth, but the clear-water discharge computed from it is not a measure of the flow. During such an event, treat level as a hazard indicator, not as a discharge.
2. Bulking changes the numbers. If a flow carries solids, the volume of the water-sediment mixture exceeds the volume of water alone; Hungr and colleagues quote a bulking factor up to about 2–3 for debris floods [1]. A discharge figure that ignores this understates what the channel carried.
3. Contact sensors are exposed. Float wells, pressure transducers and anything in the channel face impact, burial and abrasion from boulders. This is why debris-flow monitoring leans on ground vibration, video and non-contact stage sensing rather than sensors in the flow [7]. A non-contact radar level sensor measures the distance down to whatever the surface is, whether water or slurry, so it does not need to touch the flow. It still needs a mounting height above the highest surge and a clear view of the surface (see radar water level sensing explained).
4. Sampling interval decides what you see. A debris flow event is short. With the 44-second average spacing above, a 5-minute reporting interval would capture roughly one reading for every seven surges, and could miss the peak entirely. A station needs a fast mode that starts on a trigger, such as a rapid level change or rainfall, and a slower mode in between; this switch between a low-rate "non-event" mode and a high-rate "event" mode is what the reviewed monitoring sites do [7].
5. The channel changes. Scour and deposition move the bed. After an event, a gauge zero and the surveyed cross-section may no longer match the channel. Checking them is part of recovery (see river cross-section surveys and gauge zero and datum).
6. Surface velocity is harder. A Doppler velocity radar measures the speed of surface ripples; a bouldery, turbulent surge front is not a clear-water surface, so we would not treat a surface-velocity reading in a surge as a mean velocity without independent checks. Where velocity matters, ground vibration or video at two points is the route used at monitoring sites [6][7].
A worked example of warning time (illustrative)
Suppose ground sensors are 90 m apart along a channel, the spacing used at one of the sites in [6], and a front travels at 5 m/s, a value within the measured range.
travel time between sensors = 90 m ÷ 5 m/s = 18 s

A sensor 1 km upstream of a village:
travel time = 1000 m ÷ 5 m/s = 200 s ≈ 3.3 min
Those 3 minutes are the most one upstream sensor could buy in this example, so the warning must reach people automatically and locally rather than depend on a person watching a screen. For the broader contrast with slower river floods, see flash floods vs river floods, or the general article on how a flood early warning system works.
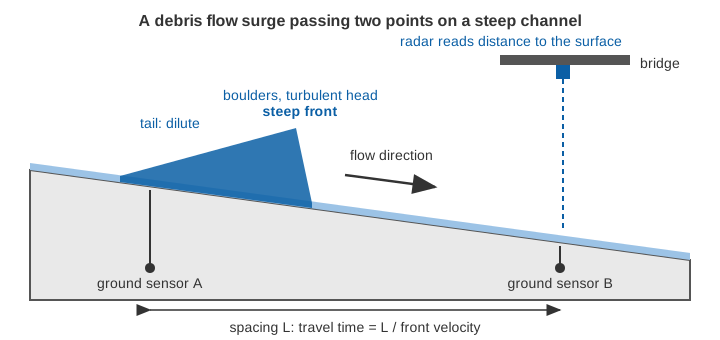
How are debris flows monitored and warned?
The review of nine sites groups the practice into three layers [7]. Rain gauges, soil-moisture and pore-pressure sensors track the conditions that lead to initiation. Flow sensors then track what is happening: stage, ground vibration from geophones, and video. Finally, thresholds on rainfall or ground vibration move the system between its low-rate and high-rate modes and trigger the alarm. Seismic data can also give a rough volume estimate: in one study a relation fitted to 14 events gave the right order of magnitude in 9 of 11 independent events [6].
A few practical consequences for stations in Himalayan streams:
- Site the station for survival. Place it on stable ground above the highest credible surge.
- Record at event rate. Keep the logging fast enough to resolve a surge, and store it on board so the record survives a link failure.
- Flag, do not hide, the data. Label readings taken during a suspected surge, so that later users do not feed them to a clear-water rating.
- Use rainfall and level together. Rainfall thresholds can warn before a flow starts; level confirms what has arrived.
Key points
- A debris flow is a very rapid, surging flow of saturated debris in a steep channel; a debris flood is water heavily charged with debris and peaks like a flood [1].
- Peak discharge of a debris flow surge can exceed that of the largest water flood by an order of magnitude [1].
- Surges can follow each other within seconds, so slow reporting misses them.
- Stage-discharge ratings, bulking and moving beds make clear-water discharge from level unreliable during an event.
- Non-contact sensing above the channel, event-rate logging and local alerting suit these streams better than contact sensors and slow polling.
Where ClimMaTech fits
At ClimMaTech we work on river and flash-flood monitoring in steep catchments, where the sensor has to survive the event and the alert has to be local. Our river monitoring solutions describe how non-contact radar level sensing, integrated data logging and sirens fit together for such sites.
References
- O. Hungr, S. Leroueil, L. Picarelli, The Varnes classification of landslide types, an update, Landslides 11(2), 167–194, 2014. doi:10.1007/s10346-013-0436-y
- R. J. Thayyen, A. P. Dimri, P. Kumar, G. Agnihotri, Study of cloudburst and flash floods around Leh, India, during August 4–6, 2010, Natural Hazards 65(3), 2175–2204, 2013. doi:10.1007/s11069-012-0464-2
- S. Duwadi, D. P. Adhikari, M. R. Dhital, N. Parajuli, Assessment of the 2021 debris flow and flood related loss and damage in Melamchi Watershed of Central Nepal, Journal of Nepal Hydrogeological Association 1(1), 107–134, 2024. doi:10.3126/jnha.v1i1.78226
- D. H. Shugar et al., A massive rock and ice avalanche caused the 2021 disaster at Chamoli, Indian Himalaya, Science 373(6552), 300–306, 2021. doi:10.1126/science.abh4455
- ICIMOD, Glacial Lakes and Glacial Lake Outburst Floods in Nepal, International Centre for Integrated Mountain Development, 2011. lib.icimod.org
- A. Schimmel, V. Coviello, F. Comiti, Debris flow velocity and volume estimations based on seismic data, Natural Hazards and Earth System Sciences 22, 1955–1968, 2022. doi:10.5194/nhess-22-1955-2022
- M. Hürlimann, V. Coviello, C. Bel, X. Guo, M. Berti, C. Graf, J. Hübl, S. Miyata, J. B. Smith, H.-Y. Yin, Debris-flow monitoring and warning: review and examples, Earth-Science Reviews 199, 102981, 2019. doi:10.1016/j.earscirev.2019.102981