
Underpass flooding and drain monitoring: sensors and alerts
What to measure at a flood-prone underpass and in the drains that serve it, which water level sensor copes with a storm drain, and how readings become alerts and better maintenance.

In a heavy downpour, water on a city's roads runs to the lowest points, and an underpass is often the lowest point of all. Underpass flooding follows when water from the ramps and nearby streets arrives faster than the drains and pumps can remove it. This article covers what to measure at an underpass and in the storm water drains around it, which water level sensor suits a drain, and how to use the readings.
Why are underpasses so dangerous in heavy rain?
They are dangerous because water collects in them quickly, and where gravity drainage is not possible they depend on pumps. India's storm water drainage manual notes that in low-lying stretches with flat slopes, pumping has become necessary [1], and warns that pump failures can flood upstream zones, with risk to property and life [2]. How little moving water it takes to knock a person over or carry away a car is set out in flash flood safety tips.
The National Disaster Management Authority (NDMA) calls such places flood hotspots: chronic spots of inundation that disrupt road and sometimes rail traffic, with new ones appearing as local hydrology changes [3]. Why city catchments produce so much fast runoff is covered in why cities flood.
What should be measured at an underpass?
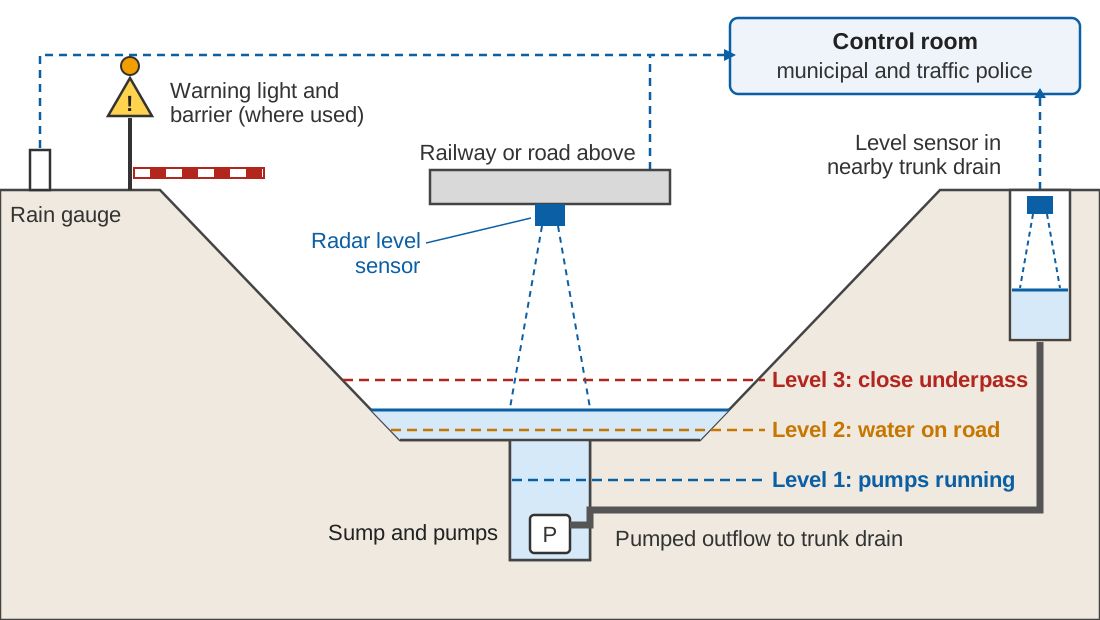
Four measurements, read together:
- Level at the low point and in the sump, the pit that collects water for the pumps. This is the direct measure of trouble.
- Level in the trunk drain the pumps discharge into. Pumps can only empty a sump if the receiving drain has room; after a power failure, the manual's procedure includes telling the upstream pumping station to stop pumping, to prevent overflow [2].
- Pump and power status. Pumps are switched by float switches, electronic probes or ultrasonic devices [1]; a running and power record shows whether the station worked.
- Rainfall close by. A level rising in heavy rain may mean the system is at capacity; a level rising in light rain points to a blockage or a pump fault.
How do you monitor water level in a storm drain?
Usually with a non-contact sensor, typically radar, fixed above the flow and looking straight down, logging readings and sending them by telemetry every few minutes. The sensor times the echo of a radio signal from the water surface (radar water level sensing).
Storm drains are hard on anything that sits in the water. NDMA names dumping of solid waste into drains as a major factor in urban flooding [3], and drains carry silt. A submerged pressure sensor converts the pressure of the water above it into depth by assuming a water density; the World Meteorological Organization (WMO) notes that such sensors vary with water temperature and density, and that intakes of in-water installations can clog with sediment [5]. Servicing one means entering the drain, which the CPHEEO (Central Public Health and Environmental Engineering Organisation) manual treats as a confined space: risk assessment, permit-to-work, continuous gas monitoring and a standby person outside [2]. A sensor above the flow can usually be reached from a walkway or bridge.
Radar has limits too. It reads whatever lies under its beam, so a floating mat of plastic can pass for the water surface, and waves affect radar gauges [5]. Mount it over calm, open water, clear of walls and falls. Ultrasonic sensors are also non-contact, but WMO lists temperature variations in the air column among their error sources [5]. The options are compared in radar vs ultrasonic, float and pressure sensors. Set any sensor's zero to a surveyed datum (gauge zero and benchmarks).
Bengaluru sited its drain water-level sensors at flood-vulnerable locations chosen also for access and safety [4].
Thresholds and alerts
NDMA asks cities to study past water levels and the flooding that followed, fix critical water levels at key points in the drainage system, and treat a flood threat as imminent once a level crosses a set fraction of the critical level [3]. At an underpass the levels are physical:
- Level 1 in the sump: pumps should be running. A level above this and still rising while pumps report running points to a blocked inlet, a failed pump or a full receiving drain.
- Level 2 at the road's low point: water is on the carriageway; the control room and traffic police need to know.
- Level 3 above the road: the depth at which the city has decided the underpass must close.
Police manage traffic during urban flooding [3], so they belong on the alert list with the pump crews; where a city uses warning lights or barriers, the Level 3 alert should reach whoever operates them. In Bengaluru, drain sensors report every 15 minutes and authorities are alerted when a threshold is crossed [4]. The wider warning chain is covered in urban flood warning systems in Indian cities.
Worked example: how often should the sensor report?
Illustrative numbers: Level 3 is 30 cm above Level 2, and in an intense storm the water rises 1.5 cm a minute.
Time from Level 2 to Level 3 = 30 cm ÷ 1.5 cm/min = 20 minutes
Rise between two reports at 15-minute intervals = 1.5 cm/min × 15 min = 22.5 cm
Most of that window could pass between two readings. Shorter intervals during rain, or a report sent as soon as a threshold is crossed, keep the control room close to the real level.
How can underpass flooding be prevented?
Mostly before the rain, by desilting drains and maintaining pumps. CPHEEO asks for drains to be inspected and cleaned before, during and after the monsoon, desilted thoroughly before it arrives, with gratings and covers checked, and suggests a water flow test after desilting [2]. NDMA sets 31 March as the date for finishing pre-monsoon desilting of major drains [3]. A level record makes the check routine: a drain that fills higher in a moderate storm than last year has changed. Pump servicing and a power-failure drill belong on the same list (pre-monsoon readiness checklist).
Using the record
- Hotspot mapping. NDMA asks for a post-season review to identify fresh hotspots [3], and CPHEEO recommends marking them on a GIS platform [2]. Logged levels show how often, how deep and how long each site flooded.
- Capacity checks. CPHEEO's recommended design return period for central business and commercial, industrial and urban residential areas is once in 5 years in Class I cities (population 100,000 and above) and once in 2 years in other cities [1]. If the storm that flooded an underpass was smaller than that on the local IDF curve, look at blockage, pumps or the outfall before building a bigger drain.
- Model calibration. Bengaluru's urban flood model was calibrated against its drain sensor records [4].
Key points
- Underpasses are low points; where they rely on pumps, a pump or power failure means flooding.
- Measure sump and low-point level, receiving-drain level, pump and power status, and nearby rainfall.
- In storm drains, a radar sensor above the flow avoids silt, waste and confined-space entry.
- Set critical levels from past records, stage the response, and report often enough to catch a fast rise.
- Desilt before the monsoon and use the record to map hotspots and check drain capacity.
Where ClimMaTech fits
At ClimMaTech we work on the observing end of urban flood monitoring: water levels at drains, underpasses and other hotspots. Tarang, our AWLR (Automatic Water Level Recorder), is a non-contact radar sensor that mounts above the water, keeps its own record on board and reports over GSM. Our approach to city drainage hotspots is described on the urban flooding page.
References
- Central Public Health and Environmental Engineering Organisation (CPHEEO), Ministry of Housing and Urban Affairs, Manual on Storm Water Drainage Systems, Volume I, Part A: Engineering Design, MoHUA, 2019. web.archive.org copy of mohua.gov.in PDF (archived copy)
- Central Public Health and Environmental Engineering Organisation (CPHEEO), Ministry of Housing and Urban Affairs, Manual on Storm Water Drainage Systems, Volume II, Part B: Operation and Maintenance and Part C: Management, MoHUA, 2019. web.archive.org copy of mohua.gov.in PDF (archived copy)
- National Disaster Management Authority, National Disaster Management Guidelines: Management of Urban Flooding, NDMA, Government of India, September 2010. ndma.gov.in (PDF)
- P. P. Mujumdar, M. S. Mohan Kumar, G. S. Sreenivasa Reddy, Shubha Avinash, I. Chawla, G. S. Kaushika et al., Development of an urban flood model for Bengaluru city, Karnataka, India, Current Science 120(9), 1441–1448, 2021. doi:10.18520/cs/v120/i9/1441-1448
- World Meteorological Organization, Manual on Stream Gauging, Volume I: Fieldwork (WMO-No. 1044), WMO, 2010. old.wmo.int (PDF)