
Urban flood early warning systems in Indian cities
What a city flood warning system has to do differently from a river warning, what Mumbai, Chennai and Bengaluru have built, and what the NDMA guidelines ask every city to put in place.

A short, heavy storm over an Indian city can flood an underpass long before any river rises. A river warning can give a downstream town hours or days of notice. In a city, the warning often has to come in minutes, and it must reach ward officers, pump operators and traffic police as well as residents. An urban flood early warning system is built for that job. This article explains what such a system contains, what Mumbai, Chennai and Bengaluru have documented, and what India's national guidelines ask cities to do.
Why cities flood in the first place is covered in why cities flood: urban hydrology for planners. Here we start from the warning.
What is an urban flood early warning system?
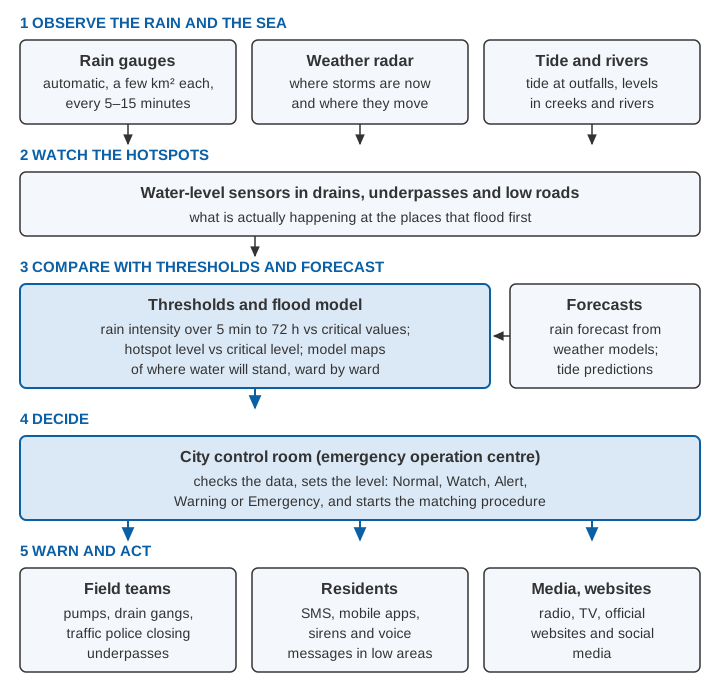
An urban flood early warning system is a chain that measures rain and water in and around a city, compares them with levels known to cause flooding, and tells the people who must act before streets and homes go under. It has the same basic parts as any flood early warning system, which are explained in how a flood early warning system works.
The National Disaster Management Authority (NDMA) set out this urban chain in its Guidelines on Management of Urban Flooding (2010), with an emergency operation centre (EOC) run by the urban local body (ULB, the municipal corporation or council) at its centre [1].
What makes urban flood warning different?
Five things set cities apart.
- Short lead time. Small urban catchments respond to rain quickly, because paved surfaces shed water and drains carry it fast. The time a catchment takes to respond is its time of concentration, explained in time of concentration. NDMA notes that weather radar can give a lead time of 3 to 6 hours for developing high-impact rain at the local scale, and that nowcasts look 5 to 30 minutes ahead [1].
- Intense, local rain. A thunderstorm can drench one ward and miss the next. The guidelines call the lack of real-time rainfall data at the city scale "a very critical gap" [1].
- Drains, not rivers, decide where water stands. Flooding depends on what the storm-water drains can carry, whether they are blocked, and whether nearby rivers or creeks are high enough to back water up into them.
- Tides. In coastal cities, drains discharge to the sea through outfalls. NDMA notes that outfalls without flood gates let sea water into the drains at high tide, and that in Mumbai only 3 of 105 outfalls had flood gates [1]. Heavy rain at high tide is the combination drains handle worst.
- Hotspots and traffic. Every city has chronic waterlogging spots: low roads, subways, railway underbridges. NDMA notes that they disrupt road and sometimes rail traffic, and that new ones appear as activities change local drainage [1]. In a city, acting on a warning often means a traffic decision: closing an underpass, diverting vehicles, moving pumps.
How does Mumbai's flood warning system work?
Mumbai's integrated flood warning system, iFLOWS-Mumbai, was developed by the Ministry of Earth Sciences (MoES) with the Municipal Corporation of Greater Mumbai (MCGM). MCGM approached MoES after repeated floods, development began in July 2019, and MoES announced its launch for 12 June 2020 [2]. The release recalls 26 July 2005, when the city received 94 cm of rain in 24 hours [2].
As documented by MoES [2]:
- Structure. Seven modules: data assimilation, flood, inundation, vulnerability, risk, dissemination, and a decision support system.
- Inputs. Weather forecast models from the National Centre for Medium Range Weather Forecasting (NCMRWF) and the India Meteorological Department (IMD); field data from rain gauge networks set up by the Indian Institute of Tropical Meteorology (IITM), MCGM and IMD; MCGM's land use, infrastructure and population layers; and river bathymetry (bed surveys) of the Mithi, Dahisar, Oshiwara, Poisar and Ulhas rivers, lakes and creeks.
- Models. Hydrologic models turn rainfall into runoff that flows into the rivers. Hydraulic models route that water to find where flooding occurs. Because Mumbai is an island city, hydrodynamic and storm-surge models compute the effect of tide and surge.
- Outputs. Flood levels estimated at ward level, with a web GIS decision support system that estimates the vulnerability and risk of what is exposed. Modelling of the city's drains was to be added in the final system.
Linking so many models is typical of coastal cities: a study of Mumbai's Mithi river watershed coupled river, storm-water drain and overland flow models with tidal influence to map inundation [3].
Real-time rain monitoring in Mumbai predates iFLOWS: after the 2005 flood, MCGM and IIT Bombay set up 35 automatic weather stations with tipping-bucket rain gauges in June 2006, mostly on fire station roofs. As NDMA described them in 2010, they sent rainfall intensity every 15 minutes to the emergency control room at MCGM headquarters, at an average density of one gauge per 16 km² and spacing of 0.68 to 4.56 km [1].
Chennai's C-FLOWS
The Coastal Flood Warning System for Chennai (C-FLOWS) grew out of the December 2015 floods. The Office of the Principal Scientific Adviser started it as a multi-institution project led by IIT Bombay, with academic partners and MoES institutes. The National Centre for Coastal Research (NCCR) integrated the parts into an operational system with the Tamil Nadu government, and it was launched on 3 November 2019 [4].
According to NCCR [4][5]:
- Models. Regional weather forecasts from NCMRWF and IMD; hydrologic models that give inflows to the Adyar, Cooum and Kosasthalaiyar rivers; hydraulic models for flooding; and hydrodynamic models for tide and storm surge.
- Flood library. About 796 pre-computed inundation scenarios for different rainfall return periods, tidal conditions and river flows.
- Decision support. A web GIS with six modules, and a "Red Atlas" action plan map that combines flood maps with street data, relief centres and evacuation locations.
- Delivery. Integration with TN-SMART, the state's disaster management portal, and mirror units in the offices of the Commissioner of Revenue Administration, the Greater Chennai Corporation and IMD.
Bengaluru and Karnataka
Karnataka's State Natural Disaster Monitoring Centre (KSNDMC) has developed an Urban Flood Model for Bengaluru with IISc [6]. KSNDMC describes a network of 100 telemetric rain gauges and 12 telemetric weather stations feeding a two-dimensional flood model, with 26 water-level sensors in place and 105 proposed. Forecasts and warnings go to government agencies by SMS, social media and a web portal. A public app, Bengaluru Megha Sandesha, shows live rainfall and inundation maps, safety tips, and an emergency link to the city corporation's control room [6].
Mumbai, Chennai and Bengaluru compared
| iFLOWS-Mumbai | C-FLOWS Chennai | Bengaluru Urban Flood Model | |
|---|---|---|---|
| Built by | MoES with MCGM [2] | Principal Scientific Adviser's project, IIT Bombay-led, operated through NCCR with Tamil Nadu [4] | KSNDMC with IISc [6] |
| Rain inputs | IMD and NCMRWF forecasts; IITM, MCGM and IMD gauges [2] | IMD and NCMRWF forecasts [4] | 100 telemetric rain gauges, 12 weather stations [6] |
| Water-level or sea inputs | River bathymetry; tide and storm-surge models [2] | Tide and storm-surge models; three rivers [4] | 26 water-level sensors, 105 proposed [6] |
| Modelling | Hydrologic, hydraulic, hydrodynamic, storm surge [2] | Same chain; library of about 796 scenarios [4] | Two-dimensional flood model [6] |
| Output | Ward-level flood levels; vulnerability and risk [2] | Inundation maps; Red Atlas action plan [4] | Live rainfall and inundation maps [6] |
| Dissemination | Dissemination module and decision support [2] | TN-SMART; mirror units with state, city and IMD [5] | SMS to agencies, web portal, public app [6] |
These documents describe what each system contains and does, not how often its warnings proved right. A city running such a system should keep that record from the first season.
What do the NDMA guidelines ask cities to do?
The 2010 guidelines give specific, measurable recommendations for early warning [1]:
- Automatic rain gauges at one per 4 km² in all Class I, II and III cities and towns, later increased to one per km² with experience. ULBs were to connect their EOCs to the gauges.
- Rain sampled every 5 to 15 minutes, depending on topography, to capture short, intense bursts.
- Doppler weather radar covering all urban centres, calibrated against the city gauges.
- Rainfall thresholds by duration. EOC software should compute rain intensity over 5, 10, 20 and 30 minutes and 1, 2, 3, 6, 12, 24, 36, 48 and 72 hours, and compare it with critical intensities for each local area derived from past records.
- Critical water levels. Automatic water level recorders throughout the drainage network, even beyond the ULB boundary. When the level at a key point crosses a set fraction of its critical level, a flood threat is assumed.
- Tide data for coastal cities.
- A graded response. Five flood categories from None to Severe, each tied to standard operating procedures for Normal, Watch, Alert, Warning and Emergency.
- Dissemination through radio, television, mobile phones and SMS, official websites and the media, issued through government officials.
Worked example: how many rain gauges does a city need?
NDMA's table of cities lists Greater Mumbai at 603 km² [1]. The arithmetic for that area is:
NDMA (1 gauge per 4 km²):         603 / 4  ≈ 151 gauges
WMO minimum (1 per 10 to 20 km²): 603 / 20 ≈ 30  to  603 / 10 ≈ 60 gauges
MCGM network of 2006:             35 gauges, about 1 per 16 km²
The NDMA figure of 151 matches the requirement in its own table [1]. The WMO density for urban areas in Guide to Hydrological Practices (WMO-No. 168) is a minimum for recording gauges, and WMO adds that urban rainfall needs a time resolution of one to two minutes with synchronised clocks [7]. How these densities are derived and applied is explained in how many rain gauges does a district need?. A network that meets the international minimum can still fall well short of the national urban guideline.
Designing a city warning chain
The documented systems and the guidelines point to the same design elements.
- Dense, fast rain data. Gauges a few kilometres apart with clocks in step, and radar to fill the gaps and show storms on the way; see weather radar, rain gauges and satellites.
- Water levels where flooding starts. Level sensors in main drains, at outfalls and at known underpasses show what the rain is actually doing on the ground.
- Thresholds from local history. Rain intensity-duration thresholds and critical drain levels must come from each city's own records and past flood events. IDF curves are a starting point for rain; graded levels work as for rivers (warning level vs danger level).
- Tide and river boundaries. Coastal and riverside cities need predicted tides and upstream river levels, because a high downstream water level can stop drains discharging however well they are kept.
- Clean data. Errors in real-time data propagate through models into wrong forecasts and responses [1], so automatic checks belong in the system; see data quality control for hydromet time series.
- Warnings to those who act. The first users of an urban warning are often field staff: pump crews, drain gangs, traffic police deciding to close an underpass. Residents in low areas need warnings in their language through more than one channel; see early warning dissemination: sirens, SMS and CAP.
Key points
- Urban flood warning is shaped by short lead times, local rain, drain capacity, tides and waterlogging hotspots.
- iFLOWS-Mumbai (2020) and C-FLOWS Chennai (2019) link weather, hydrologic, hydraulic and tide models into flood maps and decision support.
- Bengaluru's KSNDMC system uses 100 telemetric rain gauges, water-level sensors and a two-dimensional flood model.
- NDMA's 2010 guidelines ask for one automatic rain gauge per 4 km², 5 to 15 minute sampling, drain water levels, tide data, thresholds and an EOC.
- Thresholds must come from local records, and warnings must reach field teams and traffic police as well as residents.
Where ClimMaTech fits
At ClimMaTech we work on the observing and alerting ends of this chain: water levels at drain, underpass and creek hotspots, and warnings that reach the street. Tarang, our automatic water level recorder (AWLR), can watch a hotspot level, and RAKSHAK multi-hazard sirens offer a built-in library of 15–20 user-selectable siren tones and voice messages, for floods, for other disasters and civil defence (air-raid) warnings, and for voice announcements. Our approach is described on the urban flooding and flood warning pages.
References
- National Disaster Management Authority, National Disaster Management Guidelines: Management of Urban Flooding, NDMA, Government of India, New Delhi, September 2010, chapter 3 and sections 4.22 and 7.4.6. ndma.gov.in (PDF)
- Press Information Bureau, Ministry of Earth Sciences, Flood warning system for Mumbai "IFLOWS-Mumbai" to be launched on June 12, 2020, 11 June 2020. pib.gov.in
- M. Ghosh, M. P. Mohanty, P. Kishore, S. Karmakar, Performance evaluation of potential inland flood management options through a three-way linked hydrodynamic modelling framework for a coastal urban watershed, Hydrology Research 52(1), 61–77, 2021. doi:10.2166/nh.2020.123
- National Centre for Coastal Research, Ministry of Earth Sciences, Chennai Flood Warning System, NCCR, 2019. nccr.gov.in (PDF)
- National Centre for Coastal Research, Ministry of Earth Sciences, Coastal Hazards – Achievements, NCCR, 2019. nccr.gov.in
- Karnataka State Natural Disaster Monitoring Centre, Urban Flood Monitoring, KSNDMC, Government of Karnataka, 2023. ksndmc.org (PDF)
- World Meteorological Organization, Guide to Hydrological Practices, Volume I: Hydrology – From Measurement to Hydrological Information, WMO-No. 168, sixth edition, 2008, updated in 2020, section 2.4.2 and Table I.2.6, WMO, Geneva. Copy hosted by Agência Nacional de Águas, Brazil (hosted copy)