
Reservoir inflow forecasting for dam operation
How operators estimate the water about to enter a reservoir, which methods they use, and why the forecast matters as much as the level.

A reservoir is nearly full in the monsoon and heavy rain is falling upstream. Should the gates open now, or can the dam hold? The answer depends less on the water already in the reservoir than on the water about to arrive. Reservoir inflow forecasting is the work of predicting that arrival: how much, how fast and when it peaks. This article explains what inflow means, how it is forecast, how far ahead it can be done, and where the forecasts go wrong.
What is dam inflow?
Dam inflow is the rate at which water enters a reservoir, measured in cubic metres per second (m³/s, called "cumec" in Indian bulletins). It is the sum of river flow arriving from upstream, tributaries and local runoff, rain falling directly on the lake, and any release from an upstream dam. WMO's manual on flood forecasting lists the last of these, an upstream reservoir release, among the inputs a forecasting model must handle [1].
Inflow is rarely measured directly, because no single gauge catches all the water entering a reservoir. Operators calculate it from the change in reservoir level, converted to storage, plus everything that left.
How is inflow estimated from the reservoir level?
Inflow follows from a water balance over a short time step. WMO describes the level-pool method, in which the water surface is taken as level and outflow is a unique function of the water level, so storage and outflow both follow from the measured level [1]. Written as a balance:
Inflow = Outflow + (change in storage ÷ time step) + losses

change in storage ≈ reservoir surface area × change in level
Illustrative example. Take a reservoir whose water surface covers 25 km² at the current level. Over 6 hours the level rises 0.30 m, while turbines and gates together release 400 m³/s. Losses such as evaporation are small over six hours and are ignored here.
Storage gained = 25 000 000 m² × 0.30 m   = 7 500 000 m³
Over 6 h       = 7 500 000 ÷ (6 × 3600)   = 347 m³/s
Inflow         = 400 + 347                = about 747 m³/s
The balance also shows how a small level error spreads. An error of 1 cm in the level change shifts the result by 25 000 000 × 0.01 ÷ 21 600, about 12 m³/s. A drifting sensor or an uncertain release figure can each produce this much. Gate outflow depends on a rating relation, so its uncertainty enters the inflow directly; see rating curves and their uncertainty. For longer balances including evaporation, see evaporation and the reservoir water balance.
Why does the operator need a forecast?
An operator who only reacts to the level is always behind the flood. For a reservoir kept low to hold floods, WMO notes that forecast estimates of incoming flood flow over the time needed to fill and empty the reservoir are required for the best operation [1]. For reservoirs built mainly for water supply, flood operation is still an important part of management, and WMO observes that, without inflow forecasts, operating rules were commonly based on current storage with allowances for uncertainty [1].
The aim of flood operation, WMO adds, is not necessarily to hold back the whole peak, but to secure the greatest possible reduction of flow downstream, with an acceptable lag [1]. Warning people below the dam is the other half of the job; see dam water release alerts.
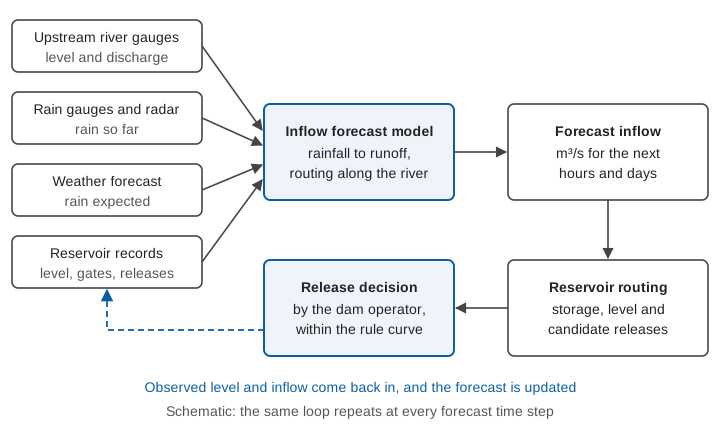
How is reservoir inflow forecast? The main flood forecasting methods
The methods are those of river flood forecasting, with the reservoir as the forecast point. They differ in what they need and how far ahead they see.
Upstream gauges and level-to-level relations
The simplest approach uses observations upstream. WMO lists statistical curves and level-to-level correlations among the simple forecasting tools [1]. If a gauge upstream rises, the reservoir will see a similar rise after the travel time of the flood wave between the two. The lead time equals that travel time, so it is short on a small hill stream and longer on a large river. It needs no rain forecast, but cannot see rain that has not yet reached the gauge.
Rainfall-runoff models
A rainfall-runoff model turns rain over the catchment into flow at the reservoir. WMO notes that telemetric rain gauge and radar data can add advance warning beyond what river data alone give, and that a rainfall forecast from a meteorological service, if it suits the model, can add several hours [1]. For models of this kind to give reasonable forecasts, WMO says the availability and accuracy of the quantitative precipitation forecast over the desired lead times are of great importance [1]. For the model families, see hydrological models explained.
Routing through the river and the reservoir
Where a catchment has long river reaches, a routing model moves the upstream flood along the channel. WMO distinguishes hydrological routing (for example Muskingum, with lumped parameters) from hydraulic routing, which solves the one-dimensional flow equations along the reach [1]. The reservoir itself is then routed with the level-pool method above, so that candidate release plans can be tested against the predicted level.
Machine learning
Data-driven models learn the link between past rain, past inflow and future inflow. Two studies on Indian reservoirs show what they can do.
- At Tenughat reservoir in the Damodar basin, a Long Short-Term Memory (LSTM) network trained on 2000-2018 data reached a Nash-Sutcliffe efficiency (NSE) of 0.938. NSE is a skill score where 1 is perfect. The study found that the previous day's inflow and rainfall had the strongest effect on the prediction. Driven by bias-corrected weather forecasts, the model held up to a 3-day lead time (NSE 0.908, 0.888 and 0.876 for 1, 2 and 3 days) [2].
- At Sri Ram Sagar Project in Telangana, a stacking ensemble of machine learning models, using rainfall, evaporation, past inflows and climate indices, reached a Kling-Gupta efficiency of 0.89 in testing, and the authors report that it simulated peak inflow events satisfactorily [3].
The first finding connects to our own work. In our study of deep learning for streamflow across 144 Indian watersheds, the best model relied on lagged streamflow, which limited its use in basins without gauges, and we built a variant that matched its skill without that input [4]. A reservoir usually has the opposite: a long record of its own inflow, so the model's strength rests on measured data, and it fails if those data are wrong. See machine learning for flood forecasting.
How far ahead can inflow be forecast?
It depends on the catchment and the method. WMO states that the achievable lead time is related to the type of catchment, and that the minimum lead time is set by the period needed for effective preparatory action [1]. With only past water-level records, extrapolating a few hours is possible. Telemetric rain gauge or radar data add more, and a rainfall forecast can add several hours to the flow-forecast lead time [1]. WMO's example from rapid-response hilly catchments in the south of France combines a 6-12 hour rain-forecast lead with about 10 hours of catchment response, giving 15-20 hours [1].
WMO notes that in larger catchments the lead time tied to rainfall observation and forecast may be less critical, while small and steep catchments respond so quickly that effective warning becomes very difficult [1]. See time of concentration for small catchments, and snow and glacier melt for Himalayan reservoirs.
Why do forecasts need updating?
WMO distinguishes models that run without updating from those that use updating, in which recent observed flows and rainfall are fed back at each forecast time. Without updating, forecasts drift away from the flows that follow [1]. Updating can substantially improve short-lead forecasts, while at longer leads accuracy depends on improving the model's simulation itself [1]. For the method, see data assimilation in flood forecasting.
What a forecast hydrograph does for operation
Illustrative example. Suppose a forecast gives the following inflow at 6-hour steps, and the operator plans releases to cut the peak. The numbers are invented to show the arithmetic.
Using the average of each pair of values over each 6-hour step (21,600 s), the reservoir storage first falls by about 4.3 million m³ relative to the start, because early releases exceed inflow, then rises to a maximum of about 31 million m³ above the start at hour 36, when inflow has fallen back to the release rate, and begins to fall. The operator therefore needs about 31 million m³ of free space, and needs it before the peak. That is only possible if the forecast arrives early enough to start the early releases. A late forecast leaves the choice between filling the space with the flood and releasing more water later, when downstream channels are already high.
How does this work in India?
India's Central Water Commission (CWC) issues inflow forecasts alongside river level forecasts. Its daily flood bulletin has a separate part for inflow forecasts, which lists reservoirs and barrages where inflow is equal to or above a specified threshold, with their full and maximum water levels, actual level, average inflow and forecast trend [5]. CWC's Wainganga Division in Nagpur, for example, issues inflow forecasts for five reservoirs: Gosikhurd, Upper Wainganga, Totladoh, Issapur (Upper Penganga) and Upper Wardha, with 24x7 control rooms from 1 June each monsoon [6]. How CWC stations feed this system is covered in India's flood forecasting network.
Where inflow forecasts go wrong
- Rain forecast error. The forecast cannot be better than the rain forecast behind it. A cloudburst missed by the weather model is missed by the inflow model.
- Wet or dry start. The same rain gives more runoff on wet soil than on dry.
- Bad inputs. A drifting level sensor or a wrong gate rating corrupts the inflow calculated from the water balance, and a model that learns from it.
- Single numbers. One hydrograph hides the spread. Ensemble forecasting gives a range from many model runs; a review of 70 papers describes the shift from deterministic to risk-based decision-making that accounts for forecast uncertainty, and stresses effective communication [7]. See ensemble forecasts.
Key points
- Dam inflow is the water entering a reservoir in m³/s, and it is mostly calculated from level change plus outflow, not measured directly.
- A forecast gives the operator time to create storage space or plan releases before the flood arrives.
- Methods range from upstream gauge relations to rainfall-runoff models, routing and machine learning; lead time depends on the catchment and the rain forecast.
- Updating with new observations improves short-lead forecasts.
- Forecasts are only as good as the level, rain and release data behind them, and they should carry an uncertainty range.
Where ClimMaTech fits
At ClimMaTech we build the field measurements that inflow forecasts rely on: river level and discharge upstream of a reservoir, and level at the dam. For dams, our dam and reservoir monitoring page describes how these observations are put together, and our flood warning page covers how the information reaches people downstream.
References
- World Meteorological Organization, Manual on Flood Forecasting and Warning, WMO-No. 1072, 2011 edition. old.wmo.int
- K. Sushanth, A. Mishra, P. Mukhopadhyay, R. P. Singh, Near-real-time forecasting of reservoir inflows using explainable machine learning and short-term weather forecasts, Stochastic Environmental Research and Risk Assessment 37(10), 2023. doi:10.1007/s00477-023-02489-y
- S. Deb, K. Arunachalam, K. S. Raju, Daily reservoir inflow prediction using stacking ensemble of machine learning algorithms, Journal of Hydroinformatics 26(5), 2024. doi:10.2166/hydro.2024.210
- S. Barbhuiya, V. Gupta, From gauged to ungauged: Large-scale deep learning rainfall-runoff modelling for reliable streamflow estimation in India's diverse basins, Environmental Modelling & Software 194, 106696, 2025. doi:10.1016/j.envsoft.2025.106696
- Central Water Commission, Daily flood situation report and forecast bulletin, Part II: inflow forecast, 10 May 2021. cwc.gov.in
- Central Water Commission, Flood forecast: Monitoring Central Organisation (Nagpur). cwc.gov.in
- W. Wu, R. Emerton, Q. Duan, A. W. Wood, F. Wetterhall, D. E. Robertson, Ensemble flood forecasting: Current status and future opportunities, WIREs Water 7(3), 2020. doi:10.1002/wat2.1432