
India's rainfall datasets agree on seasons, not storms
We put IMD's gauge-based rainfall grid side by side with CHIRPS, ERA5 and IMDAA for 2004–2020. They tell much the same story about a wet or dry monsoon for India as a whole. On a heavy-rain day in one place, they mostly disagree.

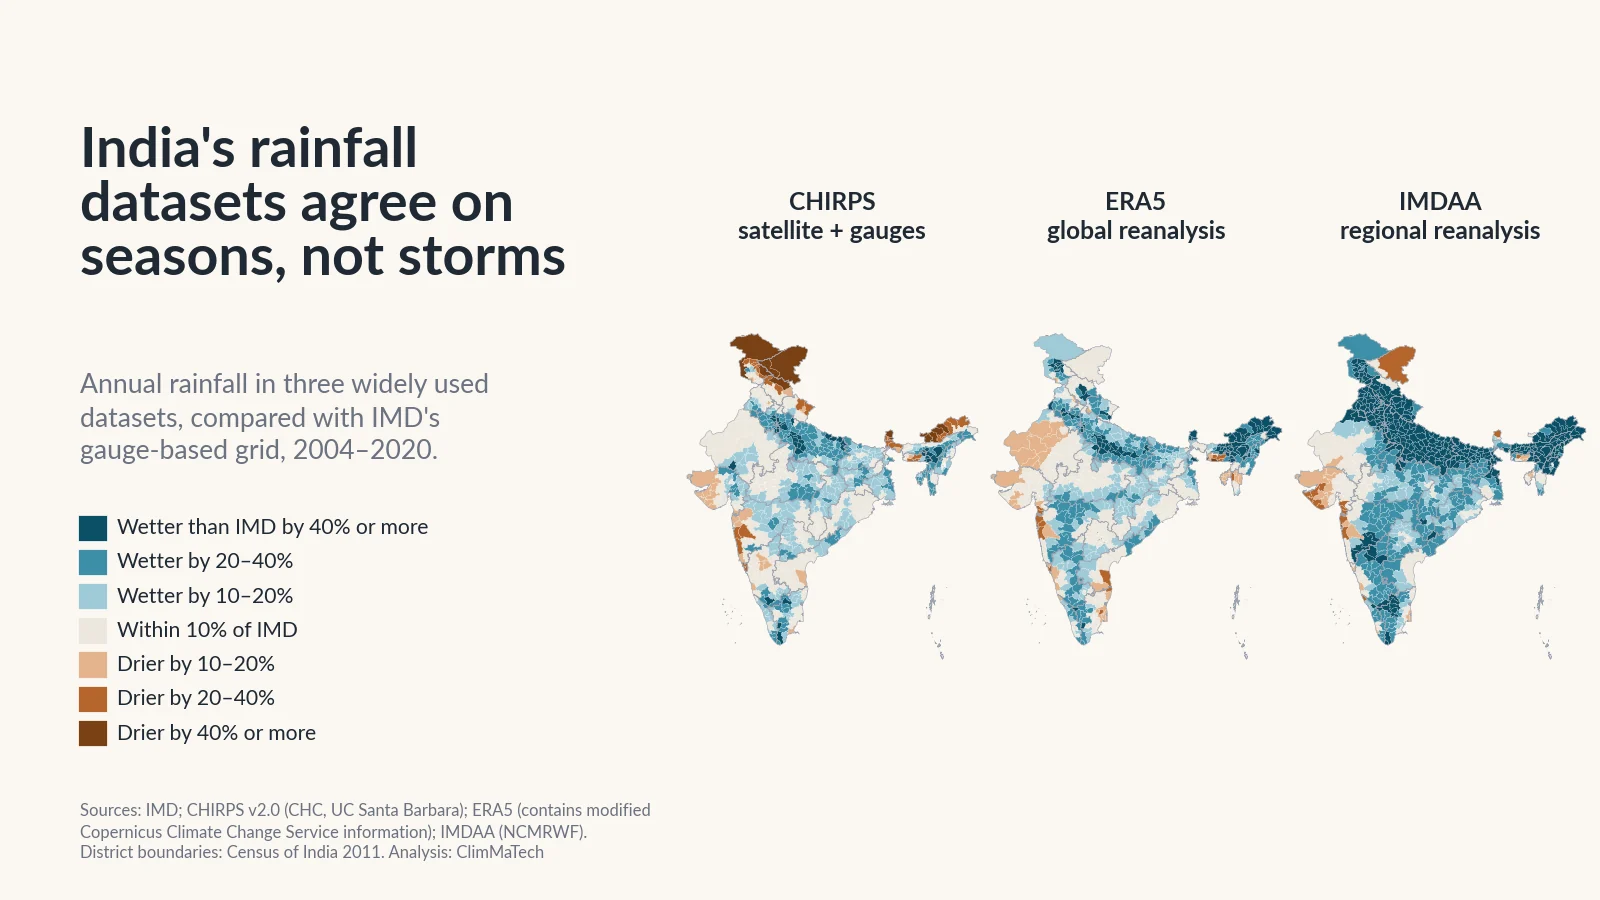
Ask four free rainfall datasets how much rain fell on your district last monsoon and you will get four answers. Ask them how much fell on the worst day of the season and the answers can differ several times over.
That matters, because these datasets drive flood and crop models, feed drought dashboards and sit behind many maps of "rainfall change". Where no gauge record exists, they are tempting inputs for sizing drains and culverts. Most users pick one and never look at the others.
So we asked: how much do India's rainfall datasets disagree, and where? We compared the India Meteorological Department's (IMD) gridded rainfall, built from rain gauges, with three widely used alternatives: CHIRPS, which blends satellite estimates with gauges, and ERA5 and IMDAA, two reanalyses, which reconstruct the weather with a forecast model.
The short answer is that they agree about seasons and disagree about storms. For India as a whole, all four rise and fall together from one monsoon to the next. On a single heavy-rain day in a single place, the other three datasets miss most of what IMD's grid records, and most of the heavy days they do report are not on IMD's grid at all. And in the Himalaya and the Northeast, they cannot even agree on how much rain falls in a year.
How we compared the datasets
The reference. IMD's 0.25° gridded daily rainfall turns readings from thousands of rain gauges into one value per day for each cell about 25 km across [1][2]. It is the dataset behind our earlier studies of heavy rain and of India's wettest days. We use it as the reference because it is built from the largest set of Indian gauges: 6,955 stations when it was first developed [1]. But it is not the true rain. Between gauges, its values are interpolated, and where gauges are few, as in the high Himalaya, it is an educated guess.
The three alternatives:
- CHIRPS (Climate Hazards group InfraRed Precipitation with Stations) estimates rain from how long cloud tops stay cold in infrared satellite images, scales that to a long-term rainfall map and then blends in station data [3]. It was built to support famine early warning, works in five-day steps and spreads each five-day total across the days using model weather fields [3]. Its station data come mostly from global public archives [3].
- ERA5 is the European Centre for Medium-Range Weather Forecasts' (ECMWF) global reanalysis: a weather model run through the past while taking in observations, with a grid of about 31 km [4]. Its rain is not observed. It comes out of the model's short forecasts [5].
- IMDAA (Indian Monsoon Data Assimilation and Analysis) is a regional reanalysis for the Indian monsoon region at 12 km, made by India's National Centre for Medium Range Weather Forecasting (NCMRWF) with the UK Met Office and IMD [6][7].
A common grid and a common period. We put every dataset on IMD's 0.25° grid and kept the 4,628 grid cells where all four have a value on every day. The common period is 2004–2020: our copy of CHIRPS starts in 2004, and IMDAA is published up to 2020 [7].
A common day. IMD's value for a date is the rain in the 24 hours ending at 8:30 am that day. The other datasets match IMD best when their previous day is used, so we compared them that way. Without the shift, their day-to-day match with IMD would be clearly worse.
What we measured. Annual and June–September totals; heavy-rain days, with 64.5 mm or more in a day, IMD's threshold for heavy rain [8]; each year's wettest day; and how closely each dataset tracks IMD from one day to the next. We also asked whether the datasets agree on trends in heavy-rain days. Every district value is the average over the grid cells touching that district. The details are in the Method section.
Do India's rainfall datasets agree?
On the big picture, yes. Averaged over the country, the four datasets rise and fall together from one monsoon to the next.
The year-to-year correlation of the season totals with IMD's is 0.90 for CHIRPS, 0.88 for ERA5 and 0.89 for IMDAA. IMD, CHIRPS and IMDAA all make 2009 the driest monsoon of the 17; ERA5 makes it the second driest. If your question is "was this a good or a bad monsoon for India?", any of the four will give you the right answer.
The levels are another matter. IMD averages 1,113 mm a year over these cells. CHIRPS gives 3% more, ERA5 14% more and IMDAA 32% more. IMDAA's whole curve sits above the rest.
The agreement also fades quickly as you zoom in. Over all of India, the daily June–September rain in ERA5 tracks IMD's with a correlation of 0.95. In a single 25 km cell, the daily correlation falls to about 0.5 for all three datasets. A correlation of 0.5 means that the datasets share only about a quarter of their day-to-day variation.
This matches earlier tests over India, which found CHIRPS close to gauge-based estimates at monthly scale [9] and ERA5 the best of five recent reanalyses for monsoon-season rainfall [10]. It is the pattern behind the title. The datasets are built differently, and their differences largely cancel out over large areas and long periods. They do not cancel on the scale of a day and a district, which is the scale at which floods, landslides and crop damage happen.
Where do they disagree most?
Pick a dataset and a measure on the map. Teal districts get more rain in that dataset than on IMD's grid, brown ones less. Tap a district to see all four side by side.
Across the 689 districts we could compare, CHIRPS is within 20% of IMD's annual rainfall in 458, ERA5 in 411 and IMDAA in 200. All three are within 20% of IMD in only 154 districts. Elsewhere, at least one of these widely used datasets differs from IMD by a fifth or more in an average year.
The Himalaya: no one knows the true total
In the Western Himalaya the datasets do not even agree on the sign of the difference. CHIRPS is 27% drier than IMD, ERA5 16% wetter and IMDAA 42% wetter. In Jammu and Kashmir CHIRPS is 39% drier. In Lahul and Spiti, it gives about half of IMD's annual rain; in Mandi, IMDAA gives about twice as much.
Who is right? Probably none of them. Mountain rain is badly sampled from every direction. Direct measurements at high altitude are scarce, so a grid built from gauges sees little of the rain and snow on high slopes [11]. In the upper Indus basin, Immerzeel and colleagues worked backwards from glacier mass balance and river flow and found that high-altitude precipitation must on average be more than twice what valley stations and gridded products show [11]. Satellites struggle too. In our own study with colleagues in Bhutan, monthly satellite rainfall (TRMM) tracked 32 gauges in the southern Himalaya well but underestimated their totals [12]. Reanalyses, for their part, have to represent rain on terrain their grids smooth out.
The Northeast: wet everywhere, but how wet?
IMD gives the Northeast about 2,320 mm a year over these cells. CHIRPS is close, at 4% less. The two reanalyses are far wetter: ERA5 by 33% and IMDAA by 64%. IMDAA also gives the Northeast 7.6 heavy-rain days a year against IMD's 4.5. In Arunachal Pradesh, ERA5 and IMDAA are 68% and 85% wetter than IMD, while CHIRPS is 31% drier. In Tawang district CHIRPS gives only a fifth of IMD's rain.
The reference is uncertain here too. In our study of heavy rain in cities, the grid cell over Shillong showed its annual rainfall falling from about 6,660 mm to 2,910 mm between two 15-year periods, a change too large to be the weather and more likely a change in the gauges behind it.
The west coast: right total, wrong storms
On the west coast, the yearly totals look reassuring: all three alternatives are within 10% of IMD. The heavy days tell a different story. IMD's grid gives the coast and the Western Ghats about 10 heavy-rain days a year. CHIRPS agrees, with 9.7. ERA5 gives 4.6 and IMDAA 3.0. The reanalyses deliver the coast's rain as many moderate days rather than fewer heavy ones, and their average wettest day of the year is 106 mm and 90 mm, against IMD's 148 mm.
Mumbai Suburban is the extreme case: 12.7 heavy days a year on IMD's grid, 14.9 in CHIRPS, 3.9 in ERA5 and 0.9 in IMDAA.
The physics helps explain this. Heavy rain over coastal mountains in the Asian monsoon, the Western Ghats among them, often falls from relatively shallow clouds. Satellite microwave methods, which assume that heavy rain comes from tall clouds, conspicuously underestimate it [13]. A global model, on the other hand, does not resolve individual storms. Its rain is an average over a grid box, and ECMWF's own guidance says local extreme totals are systematically underestimated [14]. CHIRPS does better here, perhaps because its long-term rainfall map, built partly from station records, already carries the coast's very wet climate [3].
The arid west and the plains: small totals, missing extremes
In West Rajasthan and Saurashtra–Kutch, the annual totals of all three alternatives are within 11% of IMD's. But IMD's grid gives a typical place there one heavy-rain day a year, while CHIRPS gives about one every three years, and its average wettest day is 41% lower than IMD's. In dry regions, a year's rain can come on a few days, so a dataset that flattens those days gets the risk wrong even when it gets the total right.
Across the Gangetic plain the alternatives are wetter than IMD. In East and West Uttar Pradesh, CHIRPS and ERA5 add 25–31% and IMDAA 70–74%. Several of Delhi's districts get about twice IMD's annual rain in CHIRPS. On these flat plains, the differences probably say more about the alternatives than about IMD.
Can they see a heavy-rain day?
This is where the datasets part company most clearly.
Nationally, a typical cell on IMD's grid has 2.07 heavy-rain days a year. CHIRPS has 39% fewer, ERA5 30% fewer and IMDAA 15% fewer. The year's wettest day is lower too: 90 mm on average on IMD's grid, 65 mm in CHIRPS, 78 mm in ERA5 and 83 mm in IMDAA.
Counting heavy days is one thing. Catching them on the right day is harder. Of all the cell-days that IMD's grid marks as heavy, CHIRPS also had 64.5 mm or more in the same cell on the same day on only 17%. ERA5 and IMDAA caught 19%. Allowing a day either side raises this only to 28–30%. The other way round, 72% of CHIRPS's heavy cell-days, 73% of ERA5's and 78% of IMDAA's are not heavy on IMD's grid that day.
Only on the west coast does any dataset catch more than a third of IMD's heavy days: CHIRPS catches 37% on the day and 62% within a day. In the median district the three datasets catch 12–15%.
Part of this is the threshold: 64 mm in one dataset and 65 mm in another counts as a miss. But a gap this large reflects how each dataset is built: CHIRPS spreads five-day totals across days [3]; the reanalyses produce rain from a model that cannot place a storm to the nearest 25 km and the nearest day [5][14]. In our earlier study of satellite products against IMD's grid, we likewise found that their skill with extremes varies strongly from region to region across India [15].
Three storms, four datasets
Here are three well-documented storms, each with a gauge reading published by IMD or in the research literature.
Mumbai, 26–27 July 2005. The Santacruz observatory recorded 944 mm in the 24 hours ending 8:30 am on 27 July, while Colaba, at the southern tip of the city, recorded 74 mm [16]. IMD's grid puts 492 mm on Santacruz's cell and 732 mm on the cell just to the north. CHIRPS's wettest cell in the area that day has 151 mm, ERA5's 90 mm and IMDAA's 65 mm. Even over three days, none of the three puts more than about 320 mm on any cell around the city. All four datasets saw a wet day; only the gauge-based grid saw anything like a record.
Uttarakhand, 16–17 June 2013. IMD reported 37 cm at Dehradun in the 24 hours to 8:30 am on 17 June, the maximum in the heavy-rain belt over western Uttarakhand that day [17]. IMD's grid has 271 mm in Dehradun's cell; the other three have 69–114 mm. The higher catchments are a different picture. Over the four days from 15 to 18 June, the cell containing Kedarnath gets 218 mm on IMD's grid, 220 mm in CHIRPS, 312 mm in ERA5 and 599 mm in IMDAA. Without a gauge record for that cell, no one can say which is right. That is exactly the problem.
Chennai, 1–2 December 2015. City gauges recorded between 77 mm and 494 mm in the 24 hours to 8:30 am on 2 December, an average of 286 mm [18]. Here IMD's grid is above the gauge average, at 350 mm. CHIRPS has 142 mm, ERA5 35 mm and IMDAA 20 mm. Over the four days from 30 November, the reanalyses put 74–123 mm on the city's cell, against 458 mm on IMD's grid.
Two lessons stand out. The alternatives can miss a city's worst day of the decade almost entirely. And IMD's grid, the best of the four for these events, is still not a gauge: it roughly halved Santacruz's total and overshot Chennai's average.
Do they agree on trends?
Our first case study found that heavy-rain days rose clearly in 120 districts and fell clearly in 140 between 1979–93 and 2009–23, on IMD's grid. Do the other datasets tell the same story? We tested two ways.
Over the common period, 2004–2020. Seventeen years is short for trends, and it shows: in no district does the heavy-day trend survive a correction for testing hundreds of districts, in any of the four datasets. The direction of the trend agrees with IMD's in 64% of districts for CHIRPS, 58% for ERA5 and 52% for IMDAA, where a coin toss would give 50%. IMD's grid has 73 districts with a clear difference between 2004–12 and 2013–20; CHIRPS shows the same clear change in 2 of them, ERA5 in 5 and IMDAA in 7.
Over the long run, IMD against IMDAA. IMDAA starts in 1979, so we can repeat our first study's comparison with it, using 2006–20 as the recent period because IMDAA ends in 2020. On IMD's grid, by the first study's rule, 136 districts gain heavy days and 139 lose them. IMDAA agrees on 27 of the gains and 69 of the losses. In 24 of IMD's 136 gaining districts, IMDAA shows a clear loss. Overall the two give the same verdict in 64% of districts, most of them districts where neither sees a clear change.
The falls hold up better than the rises. In the 140 districts where our first study found fewer heavy days, IMDAA also shows a fall in 118. In the 120 where it found more, IMDAA shows a rise in only 73.
A reanalysis is not a clean check on trends either. Over these cells, IMDAA's annual rainfall averages 21% more than IMD's in 1979–1999 and 32% more in 2000–2020. These data cannot tell whether that step is in the weather or in what the reanalysis takes in. IMD's grid has a similar weakness: the gauges behind it change over time [1][19]. A trend found in only one dataset deserves caution. A trend that two datasets built in different ways both show deserves more trust.
What it means for users
No dataset is best for every job. Here is how we would choose among these four.
| Use | What matters most | Our choice, and the caution |
|---|---|---|
| A wet or dry monsoon for India, a state or a large basin | Year-to-year ups and downs | All four agree well. Use IMD for India, and say which dataset you used. |
| Long-term water balance of a catchment | The right annual total | IMD where gauges are dense. In the Himalaya and the Northeast, compare at least two datasets and treat the spread as your uncertainty. Expect reanalyses to be wetter. |
| Heavy-rain and flood-risk mapping | The right number of heavy days in the right place | IMD's grid, with care in mountains. Not ERA5 or IMDAA on the west coast, where they show a third to half of IMD's heavy days. |
| Design rainfall for drains, culverts and spillways | The largest falls, over hours | None of these. Use station records of short-duration rain to build intensity–duration–frequency curves. All three alternatives understate the year's wettest day. |
| Flood and flash-flood warning | Rain now, at the place it falls | None of these. Use real-time rain gauges and water-level sensors, with radar where it reaches. |
| Trends in extremes | A steady record | IMD over the longest period, checked against an independent dataset. Be wary of trends that only one dataset shows. |
A few principles sit behind the table.
Match the dataset to the scale. The agreement at the scale of India and a season does not carry over to a district and a day. If your decision depends on a single day's rain in one valley, none of these grids will settle it. Our guide to who sees what explains why each type of measurement has its own footprint and blind spots.
Treat the spread as information. Where the datasets disagree by 30% or more, as in much of the Himalaya and the Northeast, that disagreement is the honest measure of how little we know. Picking the dataset that suits your argument hides it.
For design, go to the gauges. A drain floods in an hour, not in a day. Design rainfall needs intensity–duration–frequency curves built from recording gauges, and those curves inherit every error of the gauge, from siting to calibration (see tipping-bucket rain gauge errors).
Why ground gauges with real-time telemetry still matter
Every dataset in this study depends on rain gauges. IMD's grid is made from them. CHIRPS blends them in and calibrates its long-term map to them [3]. Reanalyses take in surface observations and are checked against gauges [6]. Yet gauges are scarce: Kidd and colleagues estimated that if each gauge available to the Global Precipitation Climatology Centre represented a circle 5 km in radius, together they would cover only about 1% of the Earth's surface [20].
Gauges also matter for timing. A satellite product or a reanalysis tells you about yesterday's storm, or last month's. CHIRPS's final product, for example, arrives about three weeks after the rain [3]. For a flash flood, the warning has to come within the hour. Only a gauge that reports in real time, close to where the rain falls, can do that.
And gauges are the only way out of the disagreement in the places where it is largest. In the Himalaya and the Northeast, where the alternatives differ from IMD's annual totals by as much as 64%, every new well-sited, well-maintained gauge with a long record improves the reference for all of them.
What would help
- More gauges in the mountains and the Northeast, especially at height, where today's datasets differ most and where the reference is least certain. Our note on how many rain gauges a district needs sets out the guidance.
- Recording, real-time gauges that report rain by the hour, so that warnings, design curves and dataset checks can use sub-daily data.
- Open access to station records. Lin and Huybers showed that without the underlying station data, outside researchers cannot fully check how network changes shape the record [19].
- Reporting the dataset and its spread. Any map of Indian rainfall or rainfall change should say which dataset it uses, and ideally show how a second dataset compares.
Key points
- We compared IMD's gauge-based gridded rainfall with CHIRPS (satellite and gauges), ERA5 and IMDAA (reanalyses) on a common 0.25° grid for 2004–2020.
- For India as a whole, they agree on good and bad monsoons: season totals correlate with IMD's at 0.88–0.90 year to year. In a single 25 km cell, the daily correlation is only about 0.5.
- Annual totals differ: CHIRPS is 3% wetter than IMD, ERA5 14% and IMDAA 32%. All three are within 20% of IMD in only 154 of 689 districts. The largest differences, of both signs, are in the Himalaya and the Northeast.
- The alternatives show 15–39% fewer heavy-rain days than IMD and catch only 17–19% of IMD's heavy days in the same cell on the same day. On the west coast, the reanalyses show a third to half of IMD's heavy days.
- In the Mumbai 2005, Uttarakhand 2013 and Chennai 2015 storms, the three alternatives put 20–148 mm on the cell at or next to the gauge on days when gauges recorded 286–944 mm.
- Trends in heavy-rain days agree poorly between datasets. Falls found on IMD's grid hold up in IMDAA more often than rises.
- For warnings and design rainfall, none of these grids replaces local, recording, real-time rain gauges.
At ClimMaTech we work on measuring rain and water where they matter. VARSHAQ, our weather station in development, is designed to record rainfall where it falls and report it in real time. On rivers and streams, Tarang, a radar automatic water level recorder (AWLR), and PRAVAAH, which combines an AWLR with a surface velocity radar (SVR) and, with a surveyed cross-section and a site-calibrated coefficient, measures discharge without touching the water, show what that rain does downstream.
Method
Reference data: IMD 0.25° × 0.25° gridded daily rainfall [1][2]. Each value is the rain in the 24 hours ending at 8:30 am IST on the date shown. IMD makes the data available for download from its Pune website, asks users who refer to it to cite Pai et al. (2014) and states that it cannot guarantee that the data are correct in all circumstances [2].
CHIRPS: version 2.0, daily, 0.05° [3][21]. CHIRPS is in the public domain [21]. Our copy runs from 2004.
ERA5: the daily mean total precipitation rate (a flux, in kg m⁻² s⁻¹) from the ERA5 reanalysis on its native 0.25° grid, multiplied by 86,400 seconds to give millimetres per day [4][5]. Values below zero (about −0.00004 mm, a numerical artefact on dry days) were set to zero. ERA5 is distributed by the Copernicus Climate Change Service under a CC-BY licence [5]. This article contains modified Copernicus Climate Change Service information; neither the European Commission nor ECMWF is responsible for any use that may be made of the Copernicus information or data it contains.
IMDAA: daily accumulated precipitation, 0.12°, from the IMDAA regional reanalysis [6], distributed through NCMRWF's data portal under a CC-BY licence [7]. As NCMRWF asks, we acknowledge that the IMDAA reanalysis was produced under the collaboration among NCMRWF, the UK Met Office and IMD with financial support from the Ministry of Earth Sciences under the National Monsoon Mission programme [7]. Each yearly file we hold has one extra one-hour step labelled 1 January of the next year; it was dropped.
Common grid and period: CHIRPS and IMDAA were averaged onto IMD's 0.25° cells with weights equal to the area each fine cell shares with the IMD cell (first-order conservative remapping); a value needs at least half of the cell covered. ERA5's grid points coincide with IMD's cell centres. We used 1 January 2004 to 31 December 2020 and the 4,628 cells with a value on every day in all four datasets.
Day alignment: for each alternative dataset we correlated its June–September daily values with IMD's for shifts of −1, 0 and +1 day, over all cells together. All three matched IMD best when their previous day was compared with IMD's date (correlations 0.49, 0.49 and 0.47 for CHIRPS, ERA5 and IMDAA, against 0.34, 0.42 and 0.39 without a shift), so all daily measures use that shift. The first and last day of the period were dropped from daily measures. Annual and seasonal totals use the unshifted data.
Measures, per cell: average annual and June–September totals; days a year with 64.5 mm or more (heavy) and 115.6 mm or more (very heavy) [8]; the average of each year's wettest day and the wettest day of the period, counting only cell-days that at least one of the eight neighbouring cells supports with at least half as much rain, as in our wettest-days study; the Pearson correlation of daily values with IMD's over all days and over June–September days; and a heavy-day contingency table against IMD: hits (64.5 mm or more in both), misses (IMD only) and false alarms (the other dataset only). "Caught" is hits ÷ (hits + misses); the "not on IMD's grid" share is false alarms ÷ (hits + false alarms). A version with a one-day tolerance counts a hit if the other dataset reached 64.5 mm on the day before, the day or the day after.
Districts and regions: 2011 Census district boundaries [22]; a district's value uses all common cells touching it (689 districts). Totals are compared as ratios of sums over the cells, correlations are cell averages and contingency counts are summed over cells. Districts with fewer than five heavy cell-days on IMD's grid are not scored for detection. Regions are groups of IMD meteorological subdivisions from India-WRIS [23]; a cell belongs to the subdivision containing its centre.
Scale comparison: correlations of monthly totals per cell (averaged over cells), of the all-India daily average for June–September days, and of the all-India June–September total across the 17 years.
Trends: for each district and dataset, the yearly heavy-day count averaged over its cells, 2004–2020. Mann–Kendall test [24] with Sen's slope [25]; false discovery rate controlled at 0.10 with the Benjamini–Hochberg procedure [26]. A clear change means the 2013–2020 mean differs from the 2004–2012 mean by at least twice its standard error. For IMD and IMDAA, the same district series for 1979–2020 compared 1979–1993 with 2006–2020, by our first study's rule (a change of more than 0.5 heavy days a year). Our first study's own verdicts (1979–93 against 2009–23, IMD) were recomputed from its district series.
Events: values for the cell containing the gauge (or, where a dataset has no value there, the nearest cell where both it and IMD have one) on the gauge's reporting day, plus multi-day totals: 26–28 July 2005 (Mumbai), 15–18 June 2013 (Uttarakhand), 30 November–3 December 2015 (Chennai). Gauge values are as published [16][17][18].
Caveats: IMD's grid is an interpolation of gauges and is not the true rain, least of all where gauges are sparse. All four datasets are averaged to 25 km cells, which smooths local extremes. CHIRPS's daily values come from disaggregated five-day totals, so its day-to-day timing is weaker by design. Seventeen years is a short period for trends. Maps are approximate and not to scale.
References
- Pai, D.S., Sridhar, L., Rajeevan, M., Sreejith, O.P., Satbhai, N.S. and Mukhopadhyay, B., Development of a new high spatial resolution (0.25° × 0.25°) long period (1901–2010) daily gridded rainfall data set over India and its comparison with existing data sets over the region, Mausam 65(1), 1–18, 2014. https://doi.org/10.54302/mausam.v65i1.851
- India Meteorological Department, Pune, High resolution (0.25 × 0.25 degree) gridded daily rainfall data (NetCDF), IMD. https://www.imdpune.gov.in/cmpg/Griddata/Rainfall_25_NetCDF.html
- Funk, C., Peterson, P., Landsfeld, M., Pedreros, D., Verdin, J., Shukla, S., Husak, G., Rowland, J., Harrison, L., Hoell, A. and Michaelsen, J., The climate hazards infrared precipitation with stations—a new environmental record for monitoring extremes, Scientific Data 2, 150066, 2015. https://doi.org/10.1038/sdata.2015.66
- Hersbach, H., Bell, B., Berrisford, P., Hirahara, S., Horányi, A., Muñoz-Sabater, J. et al., The ERA5 global reanalysis, Quarterly Journal of the Royal Meteorological Society 146(730), 1999–2049, 2020. https://doi.org/10.1002/qj.3803
- Copernicus Climate Change Service, ERA5 hourly data on single levels from 1940 to present (dataset page: licence, citation) and ECMWF, ERA5: data documentation (precipitation is a forecast parameter). https://doi.org/10.24381/cds.adbb2d47 ; https://confluence.ecmwf.int/display/CKB/ERA5%3A+data+documentation
- Rani, S.I., Arulalan, T., George, J.P., Rajagopal, E.N., Renshaw, R., Maycock, A., Barker, D.M. and Rajeevan, M., IMDAA: High resolution satellite-era reanalysis for the Indian monsoon region, Journal of Climate 34(12), 5109–5133, 2021. https://doi.org/10.1175/JCLI-D-20-0412.1
- National Centre for Medium Range Weather Forecasting, RDS data portal: IMDAA regional reanalysis, 1979–2020 (terms of use and acknowledgement). https://rds.ncmrwf.gov.in/
- India Meteorological Department, National Bulletin No. 15, 11 September 2024 (rainfall intensity terms: heavy 64.5–115.5 mm, very heavy 115.6–204.4 mm, extremely heavy 204.5 mm or more), IMD, 2024. https://rsmcnewdelhi.imd.gov.in/uploads/archive/1/1_0cbf6a_15.National%20Bulletin%20No%2015-11th%20Sept2024_0830%20IST.pdf
- Prakash, S., Performance assessment of CHIRPS, MSWEP, SM2RAIN-CCI, and TMPA precipitation products across India, Journal of Hydrology 571, 50–59, 2019. https://doi.org/10.1016/j.jhydrol.2019.01.036
- Mahto, S.S. and Mishra, V., Does ERA-5 outperform other reanalysis products for hydrologic applications in India?, Journal of Geophysical Research: Atmospheres 124(16), 9423–9441, 2019. https://doi.org/10.1029/2019JD031155
- Immerzeel, W.W., Wanders, N., Lutz, A.F., Shea, J.M. and Bierkens, M.F.P., Reconciling high-altitude precipitation in the upper Indus basin with glacier mass balances and runoff, Hydrology and Earth System Sciences 19(11), 4673–4687, 2015. https://doi.org/10.5194/hess-19-4673-2015
- Adhikari, K., Choden, Y., Cheki, T., Gurung, L., Denka, T. and Gupta, V., Performance evaluation of satellite precipitation estimation with ground monitoring stations over southern Himalayas in Bhutan, Acta Geophysica 68(3), 933–943, 2020. https://doi.org/10.1007/s11600-020-00434-z
- Shige, S. and Kummerow, C.D., Precipitation-top heights of heavy orographic rainfall in the Asian monsoon region, Journal of the Atmospheric Sciences 73(8), 3009–3024, 2016. https://doi.org/10.1175/JAS-D-15-0271.1
- ECMWF, Forecast User Guide, Section 9.6: Convective precipitation. https://confluence.ecmwf.int/display/FUG/Section+9.6+Convective+Precipitation
- Gupta, V., Jain, M.K., Singh, P.K. and Singh, V., An assessment of global satellite-based precipitation datasets in capturing precipitation extremes: a comparison with observed precipitation dataset in India, International Journal of Climatology 40(8), 3667–3688, 2020. https://doi.org/10.1002/joc.6419
- Jenamani, R.K., Bhan, S.C. and Kalsi, S.R., Observational/forecasting aspects of the meteorological event that caused a record highest rainfall in Mumbai, Current Science 90(10), 1344–1362, 2006. https://www.currentscience.ac.in/Volumes/90/10/1344.pdf
- India Meteorological Department, A report on heavy rainfall over Uttarakhand during 16–18 June 2013 (draft report), IMD, New Delhi, July 2013. https://www.emc.ncep.noaa.gov/monsoondesk/ppts/ndisasters/UK_Disaster.pdf
- World Weather Attribution, Chennai floods, December 2015, 2015; published as van Oldenborgh, G.J., Otto, F.E.L., Haustein, K. and AchutaRao, K., The heavy precipitation event of December 2015 in Chennai, India, Bulletin of the American Meteorological Society 97(12), S87–S91, 2016. https://www.worldweatherattribution.org/?p=766 ; https://doi.org/10.1175/BAMS-D-16-0129.1
- Lin, M. and Huybers, P., If rain falls in India and no one reports it, are historical trends in monsoon extremes biased?, Geophysical Research Letters 46(3), 1681–1689, 2019. https://doi.org/10.1029/2018GL079709
- Kidd, C., Becker, A., Huffman, G.J., Muller, C.L., Joe, P., Skofronick-Jackson, G. and Kirschbaum, D.B., So, how much of the Earth's surface is covered by rain gauges?, Bulletin of the American Meteorological Society 98(1), 69–78, 2017. https://doi.org/10.1175/BAMS-D-14-00283.1
- Climate Hazards Center, University of California, Santa Barbara, CHIRPS: Rainfall Estimates from Rain Gauge and Satellite Observations. https://www.chc.ucsb.edu/data/chirps
- Office of the Registrar General and Census Commissioner, India, Census of India 2011: census tables, Ministry of Home Affairs, 2011. https://censusindia.gov.in/census.website/data/census-tables
- India-WRIS, Ministry of Jal Shakti, Meteorological subdivisions (layer). https://indiawris.gov.in/wris/
- Mann, H.B., Nonparametric tests against trend, Econometrica 13(3), 245–259, 1945. https://doi.org/10.2307/1907187
- Sen, P.K., Estimates of the regression coefficient based on Kendall's tau, Journal of the American Statistical Association 63(324), 1379–1389, 1968. https://doi.org/10.1080/01621459.1968.10480934
- Benjamini, Y. and Hochberg, Y., Controlling the false discovery rate: a practical and powerful approach to multiple testing, Journal of the Royal Statistical Society Series B 57(1), 289–300, 1995. https://doi.org/10.1111/j.2517-6161.1995.tb02031.x
Data credits: rainfall data from the India Meteorological Department, the Climate Hazards Center (UC Santa Barbara), the Copernicus Climate Change Service (ECMWF) and NCMRWF; district boundaries from the Census of India 2011; meteorological subdivisions from India-WRIS. Analysis, map and charts: ClimMaTech.