
Is heavy rain rising in India's cities? 463 cities tested
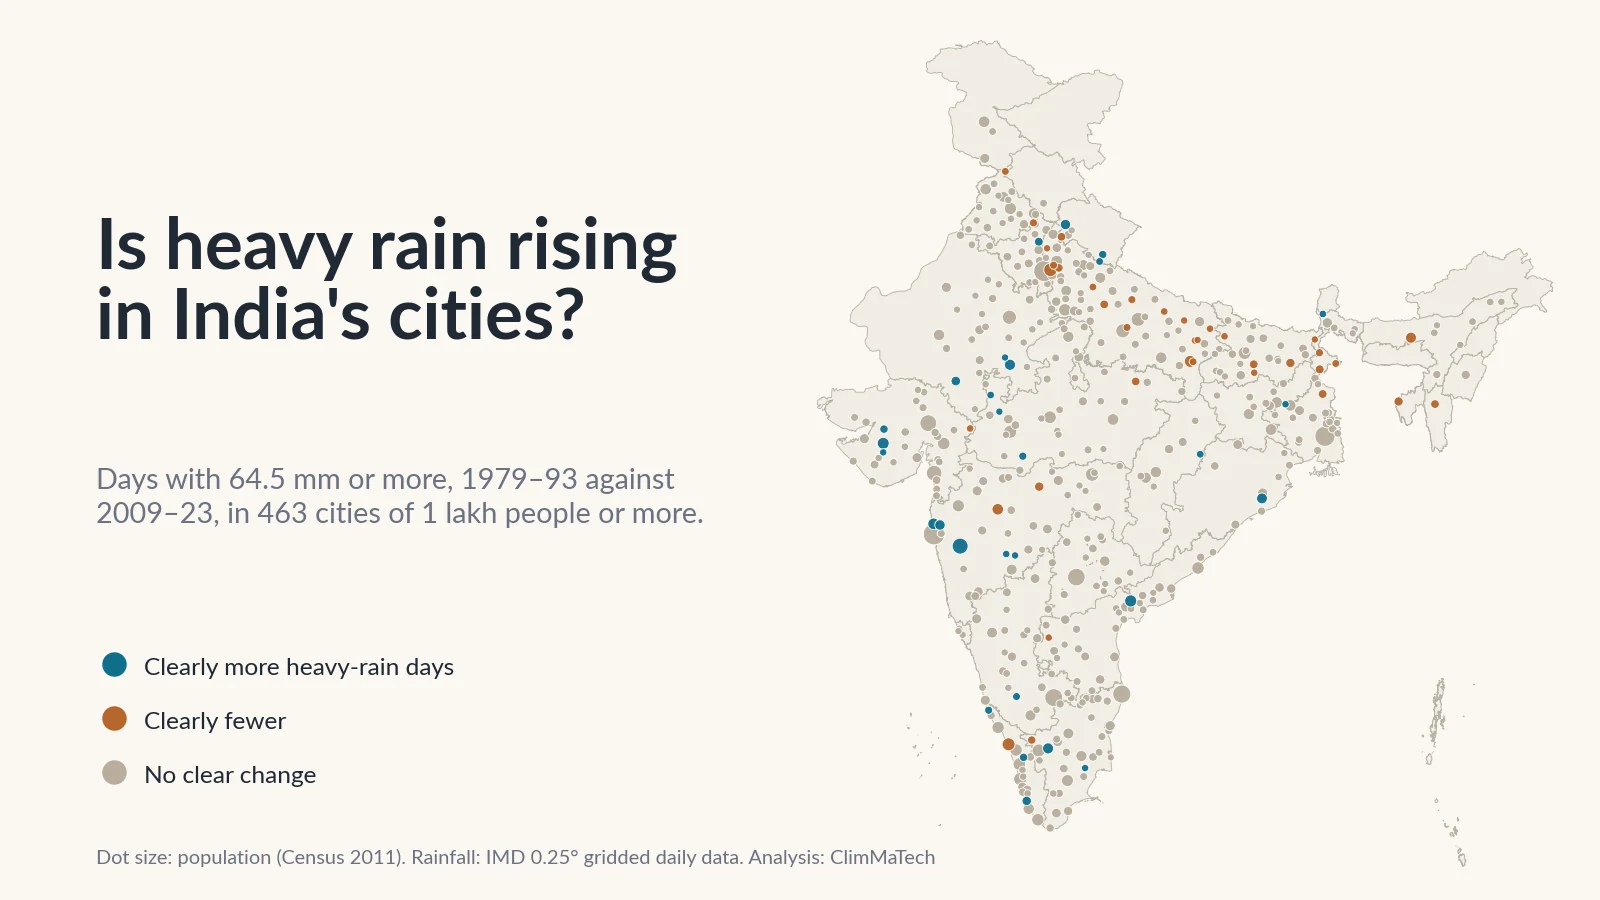
We compared heavy-rain days in 1979–93 and 2009–23 around every Indian city of 1 lakh people or more. Most show no clear change. Twenty-nine have clearly more heavy days and 37 clearly fewer, with the biggest gains around Mumbai, in Saurashtra and in the Uttarakhand foothills.

When a city floods in the monsoon, an explanation usually follows within hours: heavy rain in India's cities is increasing. It feels true. Streets that used to drain now fill, and underpasses close more often.
Is heavy rain actually rising in India's cities? We tested the claim against 45 years of the India Meteorological Department's (IMD) daily rainfall data. We took every urban agglomeration or city that had at least 1 lakh (100,000) people in the 2011 Census, 463 of them, home to about 26.4 crore (264 million) people at the time. For each one we asked whether days of heavy rain have become more common than they were a generation ago.
The short answer is no, not for Indian cities as a whole. In most cities there is no clear change. Twenty-nine cities now get clearly more heavy-rain days, and 37 clearly fewer. The gains are concentrated in a few regions: the Mumbai belt, Saurashtra, south-eastern Rajasthan and western Madhya Pradesh, the Uttarakhand foothills and parts of Kerala. The losses run across the Gangetic plain.
There is a second answer, just as important. The data cannot see rain inside a city. Its cells are about 25 km across, so one cell can hold a whole town and the countryside around it. Everything below describes the rain on the area around a city, not the downpour over one neighbourhood that floods an underpass.
We have used this record before, to count heavy-rain days by district, to find India's wettest days and to ask whether the monsoon is getting burstier. This time the unit is the city, because that is where the drains, the underpasses and most of the people are.
How we looked
The rain. We used IMD's gridded daily rainfall [1][2]. It turns readings from thousands of rain gauges into a regular grid of cells 0.25° (about 25 km) across, with one value per cell per day, from 1 January 1979 to 31 December 2023.
The cities. The 2011 Census lists 468 urban agglomerations and cities with 1 lakh people or more [3]. An urban agglomeration is a city together with the towns and built-up areas that have grown into it, so a metropolis counts once and its suburbs are not counted again. One lakh is also the line the national storm-drainage manual uses for a "Class I" city, which it asks to plan for bigger storms [4].
Where each city sits. We placed each city at its core town, using the urban locations layer of India-WRIS, the national water resources information system [5]. Each city takes the values of the grid cell that contains that point.
Of the 468, we could not place two (Greater Noida and Chapra), and Port Blair has no rainfall record. We set aside Shillong and Bagaha, whose cells' annual rainfall halves between the two periods; Shillong's falls from about 6,660 mm a year to 2,910 mm. A change that size points to a change in the gauges, not in the rain. That leaves 463 cities.
What we measured. For each city and each year:
- Heavy-rain days: days with 64.5 mm or more, IMD's threshold for heavy rain [6]. This is our main measure. A day like that can flood low streets and fill underpasses.
- Very heavy days: 115.6 mm or more [6].
- The wettest day: the year's largest daily total. As in our wettest-days study, we left out single-cell values that no neighbouring cell supports: a day counts only if at least one of the eight surrounding cells got at least half as much rain.
- Annual and June–September rainfall, and the share of the year's rain on its five wettest days.
Then and now. We compared two 15-year periods a generation apart, 1979–1993 and 2009–2023. We called a city's change clear only if the difference between the two averages is at least twice its standard error, worked out from that city's own year-to-year swings. We also ran trend tests over all 45 years. The details are in the Method section at the end.
Is heavy rain rising in Indian cities overall?
Not on this record. Averaged over all 463 cities, a city got 2.11 heavy-rain days a year in 1979–93 and 2.18 in 2009–23. Over all 45 years, the Mann–Kendall test [7] finds no significant trend in that average (p = 0.41).
The other measures tell the same story:
- Very heavy days stayed at 0.43 a year.
- The wettest day of the year averaged 93.7 mm in the early period and 92.6 mm in the recent one.
- Annual rainfall rose slightly, from 1,088 mm to 1,114 mm.
- The share of the year's rain on its five wettest days fell slightly, from 32.8% to 31.4%.
None of these changes is clear by our two-standard-error rule.
One way of counting does lean upwards. If each city is weighted by its population, the average city dweller went from 2.57 heavy-rain days a year to 2.82, and the 45-year trend in that weighted series is just significant (p = 0.04). It does not pass the stricter two-period test. Mumbai alone accounts for more than half of that lift, because it combines the largest population with one of the highest counts of heavy days.
The average hides movement in both directions. City by city, the picture looks like this:
On heavy-rain days, 29 cities rose clearly and 37 fell clearly. The other 397 show no clear change. Our test is roughly a 5% test, so even with no real change at all, about 12 cities would pass it in each direction by chance. Twenty-nine is more than chance would give, so some of the increases are real. But a clear majority of Indian cities show no measurable change in heavy rain, and more cities lost heavy days than gained them.
The 29 cities with more heavy days had about 1.7 crore (17.3 million) people in 2011. The 37 with fewer had about 1.5 crore (14.7 million). The 397 with no clear change had about 23.2 crore (232 million).
Cities also behave like the rest of the country. Across all 4,964 usable grid cells in India, 7.2% have clearly more heavy-rain days and 8.7% clearly fewer. Among the cities the figures are 6.3% and 8.0%. On this grid, a city is not a special place for heavy rain. It is a sample of the region it sits in.
Where has heavy rain clearly risen?
Teal dots on the map have clearly more of the selected measure, brown dots clearly less. Tap a dot to see both periods.
Most of the cities with a clear rise fall in a few regional clusters.
The Mumbai belt
The largest gains in India are just north and east of Mumbai. Around Vasai-Virar, heavy-rain days went from about 8.7 a year in 1979–93 to 13.1 in 2009–23, and very heavy days from about 2.5 to 4.6. Annual rainfall went from about 2,240 mm to 2,970 mm. Bhiwandi, in the next cell east, rose from about 8.5 to 12.6 heavy days, and its average wettest day from 151 mm to 212 mm.
Pune, on the other side of the Western Ghats, went from about 0.7 heavy days a year to 2.5, with its annual rainfall up from about 720 mm to 1,240 mm.
Mumbai itself is a near miss. Its cell went from about 9.3 heavy days a year to 11.2 and from about 2.9 very heavy days to 3.9. Neither change is large enough against Mumbai's big year-to-year swings to pass our test. Its annual rainfall did rise clearly, from about 2,220 mm to 2,670 mm.
Saurashtra, south-eastern Rajasthan and western Madhya Pradesh
Rajkot is the clearest case in a dry region. Its cell had fewer than one heavy-rain day a year in 1979–93 (0.87) and 3.3 in 2009–23. Very heavy days rose from 0.3 to 1.1, and the average wettest day from 92 mm to 155 mm. Gondal and Morvi nearby show the same rise. Our earlier district study found the same thing across Saurashtra.
A second dry-region cluster runs from Kota and Bundi in Rajasthan into Mandsaur, Nagda and Khandwa in Madhya Pradesh. Kota went from 0.7 heavy days a year to 1.6, and from no very heavy days at all in 1979–93 to about one every four years.
These are cities with little experience of heavy rain. Rajkot used to get a heavy day about once a year and now gets about three.
The Uttarakhand foothills
Haldwani-cum-Kathgodam went from about 2.7 heavy days a year to 6.2, one of the largest rises in the country, with annual rainfall up from about 1,440 mm to 1,910 mm. Rudrapur rose from 2.3 to 4.9 and Dehradun from 2.9 to 5.1. In Dehradun the average wettest day also rose, from 96 mm to 135 mm.
Kerala and the east
Kasaragod rose from about 7.9 heavy days a year to 11.7, Kayamkulam from 2.1 to 5.4 and Ottappalam from 3.1 to 4.9. Further east, Bhubaneswar went from 2.1 to 4.5, Vijayawada from 1.5 to 3.1 and Darjiling from 5.7 to 8.9.
More heavy days, mostly because the whole year got wetter
One thing links nearly all of these cities. Annual rainfall rose in every one of the 29, by between 6% and 73%, and clearly so in 20 of them. On average the 29 went from about 1,200 mm a year to 1,530 mm. Only 8 of them also have clearly more very heavy days, and only 9 a clearly bigger wettest day. In most of these cities the extra heavy days are part of a wetter year, not a sign that the biggest storms have grown.
Where has heavy rain clearly fallen?
The 37 cities with clearly fewer heavy days are concentrated across the Gangetic plain. Fifteen of Uttar Pradesh's 63 cities lost heavy days, and none gained them. Five cities in Bihar and four in West Bengal lost them too. Varanasi went from about 2.5 heavy days a year to 0.9, and Ghaziabad from 1.5 to 0.3. Bhagalpur went from 6.3 to 2.9, with its annual rainfall down from about 2,210 mm to 1,300 mm.
The Northeast has losses too: Guwahati went from 1.9 heavy days a year to 0.5, and Agartala from 5.0 to 3.0.
Elsewhere the losses are scattered: Kozhikode in Kerala (9.1 to 6.5), Roorkee in Uttarakhand, Aurangabad in Maharashtra and a few others.
We treat these declines with the same caution as the gains. Several come with a large fall in the year's total, and changes in the gauges behind this dataset are known to shift its statistics [8]. Where a fall is as large as Bhagalpur's, the grid alone cannot say how much is rain and how much is gauges.
What about India's largest cities?
In the ten largest cities, only Pune has a clear change in heavy-rain days. Here is how each changed between 1979–93 and 2009–23. Values are per year, in the grid cell around each city:
| City | People (2011) | Heavy-rain days | Very heavy days | Wettest day, mm | Annual rainfall, mm |
|---|---|---|---|---|---|
| Mumbai | 18,414,288 | 9.3 → 11.2 | 2.87 → 3.93 | 235 → 195 | 2,222 → 2,674 (clear) |
| Delhi | 16,314,838 | 1.0 → 0.5 | 0.13 → 0.07 | 85 → 66 | 684 → 534 |
| Kolkata | 14,112,536 | 2.7 → 2.8 | 0.87 → 0.40 | 123 → 89 | 1,748 → 1,365 (clear) |
| Chennai | 8,696,010 | 3.7 → 3.5 | 1.27 → 0.87 | 171 → 128 | 1,344 → 1,411 |
| Bengaluru | 8,499,399 | 0.8 → 1.3 | 0.00 → 0.13 | 71 → 80 | 825 → 1,087 (clear) |
| Hyderabad | 7,749,334 | 0.9 → 1.1 | 0.13 → 0.07 | 71 → 81 | 801 → 881 |
| Ahmedabad | 6,352,254 | 2.0 → 2.0 | 0.47 → 0.47 | 117 → 108 | 727 → 790 |
| Pune | 5,049,968 | 0.7 → 2.5 (clear) | 0.07 → 0.27 | 72 → 86 | 724 → 1,237 (clear) |
| Surat | 4,585,367 | 3.4 → 5.1 | 1.40 → 1.00 | 139 → 126 | 1,087 → 1,376 |
| Jaipur | 3,073,350 | 1.3 → 0.6 | 0.47 → 0.13 | 86 → 67 | 656 → 569 |
"Clear" marks a change of at least twice its standard error.
A few of these are worth a sentence each:
- Mumbai has far more heavy days than any other of the ten, and more than in 1979–93, but the rise is not clear. Its average wettest day fell from about 235 mm to 195 mm.
- Delhi went from one heavy day a year to about one every two years. Jaipur halved too. Neither change is clear, because heavy days are rare in both.
- Kolkata has about the same number of heavy days, but its annual rainfall fell clearly, from about 1,750 mm to 1,365 mm.
- Chennai has slightly fewer heavy and very heavy days, and its average wettest day fell from about 171 mm to 128 mm. The grid cell we use for it lies just north of the city point, because the city's own cell has no usable record.
- Bengaluru gained about half a heavy day a year, and its annual rainfall rose clearly, from about 830 mm to 1,090 mm.
- Surat went from 3.4 heavy days to 5.1. That is a large rise, but not quite clear by our rule, and its trend does not survive the correction for testing hundreds of cities.
Across the 53 cities with a million people or more, five have clearly more heavy days (Pune, Vasai-Virar, Rajkot, Vijayawada and Kota) and four clearly fewer (Ghaziabad, Varanasi, Aurangabad and Kozhikode).
How sure can we be?
Trend tests. We tested the 45-year series of each city's cell with the Mann–Kendall test [7] and Sen's slope [9]. With hundreds of cities, some will pass any test by chance. So we controlled the false discovery rate [10], as recommended for climate maps by Wilks [11]. Only eight cities keep a significant rise in heavy-rain days after that correction: Haldwani-cum-Kathgodam, Rudrapur, Karnal, Raigarh, Rajkot, Vasai-Virar, Kollam and Kayamkulam. Eight keep a significant fall, among them Bhagalpur, Kishanganj, Guwahati and Satna. For very heavy days, no city keeps a significant trend in either direction.
A wider window. We repeated the comparison using the average of the 3 × 3 block of cells around each city, about 75 km across. Then 22 cities show a clear rise and 31 a clear fall. Eleven of the 29 rises hold up, among them Vasai-Virar, Bhiwandi, Pune, Rajkot and Haldwani-cum-Kathgodam. The rest depend on one cell.
The gauges. The grid is only as steady as the network of gauges behind it. Lin and Huybers showed that changes in which stations report introduced a jump towards more extreme rain in this dataset after 1975, before our record begins [8]. Some later network changes are still possible. That is why we set aside Shillong and Bagaha. It is also why the very largest changes in either direction, such as Bhagalpur's fall or Raigarh's rise from 0.6 heavy days a year to 2.7, deserve a check against the gauges themselves.
What a 25 km grid can't see
A grid cell 0.25° across covers between about 660 and 770 km², depending on latitude. Every value is an average over the cell, built by interpolating between gauges that may be far apart. So the grid has three blind spots that matter most for cities.
It cannot see rain inside a city. A cloudburst over one ward and dry weather over the next appear as a moderate wet day for the whole cell. Our wettest-days study showed how far a single gauge can sit above the grid on a record day.
It cannot see the city's own effect on rain. A city has a climate of its own, different from the countryside around it, and that can change how much heavy rain falls on it [12][13]. Kishtawal and colleagues found a significant rise in the frequency of heavy monsoon rain over urban regions of India, with larger trends than over rural areas, and more likely where urbanisation was faster [12]. Shastri and colleagues compared 42 urban regions with their surroundings and found that the urban effect on extreme rain was not consistent across India. It was strongest in central and western India, with a detailed case for Mumbai [13]. Our grid places a city and its rural fringe in the same cell, so it cannot separate the two.
It cannot see hours. Drains and underpasses respond to rain over minutes to a few hours. A 70 mm day could be steady rain from morning to night or a single hour-long downpour, and the daily record cannot tell them apart.
So our result describes the regional rain each city sits in. It does not show that rain inside cities is unchanged. It shows that India's long rain record cannot answer that question.
What does this mean for city drains?
The national manual on storm-water drainage, published by the Central Public Health and Environmental Engineering Organisation (CPHEEO) in 2019, asks Class I cities, those of 1 lakh people or more, to design drains in business, industrial and residential areas for a storm that comes on average once in 5 years. Other cities design for once in 2 years. Airports and other critical infrastructure are designed for once in 100 years in Class I cities and once in 50 years elsewhere [4]. The same manual notes that drains in India are in practice designed for storms of once in one to two years [4]. We explain how this works in why cities flood.
A return period like this is read from a city's intensity–duration–frequency (IDF) curve, built from its own record of short-duration rain (see IDF curves explained). The manual asks for 25–30 years of records or more, and for the curves to be redrawn every 5–10 years because rainfall patterns change [4].
Daily grid data cannot redraw an IDF curve, but they allow a rough check. For each city's cell we took the daily rainfall that came on average once in five years in 1979–93 (the third-largest separate rain day in those 15 years) and counted how often it came again in 2009–23.
Across all 463 cities, the old once-in-five-years day came 1,390 times in the early period and 1,420 times in the recent one. That is essentially no change. In the 29 cities with more heavy days it came 217 times instead of 88, roughly once every two years instead of once every five. In 24 of those 29 it came more often. In Vasai-Virar, a day of about 190 mm, which came 3 times in 1979–93, came 17 times in 2009–23. In the 37 cities with fewer heavy days it came 53 times instead of 111.
The manual makes the same point about India as a whole. It does not set one national climate allowance for design rainfall, because some IMD stations show rising rain intensity and others falling. Instead it suggests analysing 30 years or more of local records in three 10-year groups, and raising the design intensity only where the trend is upward [4]. Our results support that approach. There is no single national answer. A drain in Vasai-Virar, Rajkot or Haldwani designed from 1980s rain records may well be meeting its design storm more often than intended. One in Varanasi or Ghaziabad may not be. Neither conclusion can be settled without hourly rain recorded in the city itself.
What would help
- A dense network of recording rain gauges inside each city. The CPHEEO manual recommends one rain gauge per 5–10 km² in cities of more than 10 lakh people and one per 10–20 km² in cities of 1–10 lakh. It also cites NDMA's call for automatic rain gauges in all urban areas at one per 4 km² [4]. Gauges like these measure the hourly rain that drains are designed for. Kept running for decades, they are the only way to see whether a city's own downpours are changing.
- IDF curves redrawn from those records, on the 5–10-year cycle the manual asks for, so that the design storm in each city follows its own rain rather than a national figure or an old regional one.
- Water-level sensors in the places that flood first: major drains, culverts and underpasses. A level record shows how often, how deep and for how long each spot floods, and helps tell a drain that is too small from one that is blocked. See monitoring storm-water drains and underpasses.
- Warnings that reach people within the hour, because a city street can fill soon after a downpour begins. That means alert levels tied to the gauges and sensors, and a way to reach people on the street and in low-lying homes, as discussed in urban flood warning systems in Indian cities.
Key points
- Across 463 Indian cities of 1 lakh people or more, heavy-rain days (64.5 mm or more) have not clearly risen. A city averaged 2.11 heavy days a year in 1979–93 and 2.18 in 2009–23.
- Heavy-rain days rose clearly in 29 cities (about 1.7 crore people in 2011) and fell clearly in 37 (about 1.5 crore). In 397 there is no clear change. By chance alone, about 12 cities would pass our test each way.
- The rises cluster around Mumbai (Vasai-Virar, Bhiwandi, Pune), in Saurashtra, south-eastern Rajasthan and western Madhya Pradesh, the Uttarakhand foothills and parts of Kerala, mostly where the whole year got wetter. The falls cluster across the Gangetic plain.
- Of the ten largest cities, only Pune has a clear rise. Mumbai and Surat rose but not clearly.
- In the 29 cities with more heavy days, the 1979–93 once-in-five-years daily rainfall now comes about every two years. Across all cities it comes as often as before.
- A 25 km daily grid cannot see rain inside a city, the city's own effect on rain, or hourly bursts. Only recording gauges in the city can.
At ClimMaTech we work on measuring rain and water where they matter. Tarang, our radar automatic water level recorder (AWLR), can watch the level in a drain, a culvert or an underpass. RAKSHAK is a multi-hazard warning siren with 15–20 user-selectable siren tones and voice messages. It carries flood alerts, warnings of other disasters and civil-defence signals. VARSHAQ, our weather station, is in development.
Method
Rainfall data: IMD 0.25° × 0.25° gridded daily rainfall [1][2], 1 January 1979 to 31 December 2023 (16,436 days). IMD provides the data for download, asks users to cite Pai et al. (2014) and states that it cannot guarantee the data are correct in all circumstances. A cell-year with any missing day was left out. A cell is usable if it has a complete record in at least 40 of the 45 years; 4,964 cells are.
Cities: All 468 urban agglomerations and cities with a population of 1 lakh or more in the Census of India 2011 Provisional Population Totals [3]. Urban agglomerations count once, with their constituent towns and outgrowths. Populations are the provisional 2011 counts; final 2011 figures differ slightly. Totals of people are therefore 2011 figures, and they count only people living in cities of this size.
Locations: India-WRIS urban locations layer [5]. Each census name was matched to a point within the same state, with a short list of spelling differences matched by hand (for example Bhubaneswar and Bhubaneshwar). Of the 466 matched points, 400 were checked to lie inside the city's census district. Where the district could not be checked, because of districts created after 2011 or the split of Andhra Pradesh, the point was checked against its census state (66 points). Delhi is placed at New Delhi.
Grid cell: the 0.25° cell containing the city point. Five cities whose cell has no usable record (Chennai, Puri, Machilipatnam, Srikakulam and Thoothukkudi) take the nearest usable cell among the eight neighbours. Some neighbouring cities share a cell, so the 463 cities sit in 444 distinct cells. Sensitivity test: the mean of the usable cells in the 3 × 3 block around the city cell.
Screening: Cities whose cell's annual rainfall halves or doubles between the two periods are shown on the map but left out of all counts. These are Shillong (about 6,660 to 2,910 mm) and Bagaha (about 1,500 to 735 mm). No other city's annual total rises by more than 73% or falls by more than 41%. Greater Noida and Chapra have no point in the WRIS layer. Port Blair's cell has no usable record.
Measures, per city cell and calendar year:
- days with 64.5 mm or more and with 115.6 mm or more [6];
- the wettest day, counting only supported cell-days (at least one of the eight neighbouring cells received at least half as much rain that day; cells with no valid neighbour count as supported);
- annual and June–September totals;
- the share of the year's rain on its five wettest days.
Clear change: the difference between the 2009–2023 and 1979–1993 means is at least twice its standard error, SE = √(s₁²/15 + s₂²/15), from the city's own yearly values. Shuffling the 30 years between the two periods 500 times for each city cell showed that the rule passes about 2.7% of cells in each direction by chance.
Trend tests: Mann–Kendall test [7] with tie correction and Sen's slope [9] on each distinct city cell's 1979–2023 series. False discovery rate controlled with the Benjamini–Hochberg procedure [10] at 0.10 across the 444 cells, as recommended by Wilks [11]. The tests do not correct for serial correlation.
Once-in-five-years daily rainfall: for each cell, rain days were separated into independent days (a day counts only if no wetter day within two days either side was already chosen), using supported cell-days only. The once-in-five-years value is the third-largest such day in 1979–1993, and we counted the days in 2009–2023 that reached it. This is a check on daily totals, not an intensity–duration–frequency analysis.
Caveats: A 0.25° daily grid smooths out short and local rain and cannot resolve rain within a city or urban effects on rain. The gauge network behind the grid changes over time [1][8]. Comparing two 15-year periods does not separate long-term change from decadal variability. Neighbouring cities that share a cell are not independent. Maps are approximate and not to scale.
References
- Pai, D.S., Sridhar, L., Rajeevan, M., Sreejith, O.P., Satbhai, N.S. and Mukhopadhyay, B., Development of a new high spatial resolution (0.25° × 0.25°) long period (1901–2010) daily gridded rainfall data set over India and its comparison with existing data sets over the region, Mausam 65(1), 1–18, 2014. https://doi.org/10.54302/mausam.v65i1.851
- India Meteorological Department, Pune, High resolution (0.25 × 0.25 degree) gridded daily rainfall data (NetCDF), IMD. https://www.imdpune.gov.in/cmpg/Griddata/Rainfall_25_NetCDF.html
- Office of the Registrar General and Census Commissioner, India, Provisional Population Totals, Census of India 2011: Urban Agglomerations/Cities having population 1 lakh and above, Ministry of Home Affairs, 2011. web.archive.org copy of censusindia.gov.in PDF (archived copy)
- Central Public Health and Environmental Engineering Organisation (CPHEEO), Manual on Storm Water Drainage Systems, Volume I, Part A: Engineering Design, Ministry of Housing and Urban Affairs, Government of India, 2019 (section 1.3, p. 3; sections 3.3–3.4, p. 27; Table 4.1, p. 52; section 4.5, pp. 63–64). web.archive.org copy of mohua.gov.in PDF (archived copy)
- India-WRIS, Ministry of Jal Shakti, Urban locations (settlement locations layer). https://indiawris.gov.in/wris/
- India Meteorological Department, RSMC New Delhi, Press release, 2 March 2022 (legend of rainfall intensity terms: heavy 64.5–115.5 mm, very heavy 115.6–204.4 mm, extremely heavy above 204.4 mm), IMD, 2022. https://rsmcnewdelhi.imd.gov.in/uploads/archive/8/8_605370_Press%20Release%2002.03.2022_1.pdf
- Mann, H.B., Nonparametric tests against trend, Econometrica 13(3), 245–259, 1945. https://doi.org/10.2307/1907187
- Lin, M. and Huybers, P., If rain falls in India and no one reports it, are historical trends in monsoon extremes biased?, Geophysical Research Letters 46(3), 1681–1689, 2019. https://doi.org/10.1029/2018GL079709
- Sen, P.K., Estimates of the regression coefficient based on Kendall's tau, Journal of the American Statistical Association 63(324), 1379–1389, 1968. https://doi.org/10.1080/01621459.1968.10480934
- Benjamini, Y. and Hochberg, Y., Controlling the false discovery rate: a practical and powerful approach to multiple testing, Journal of the Royal Statistical Society Series B 57(1), 289–300, 1995. https://doi.org/10.1111/j.2517-6161.1995.tb02031.x
- Wilks, D.S., "The stippling shows statistically significant grid points": how research results are routinely overstated and overinterpreted, and what to do about it, Bulletin of the American Meteorological Society 97(12), 2263–2273, 2016. https://doi.org/10.1175/BAMS-D-15-00267.1
- Kishtawal, C.M., Niyogi, D., Tewari, M., Pielke, R.A. and Shepherd, J.M., Urbanization signature in the observed heavy rainfall climatology over India, International Journal of Climatology 30(13), 1908–1916, 2010. https://doi.org/10.1002/joc.2044
- Shastri, H., Paul, S., Ghosh, S. and Karmakar, S., Impacts of urbanization on Indian summer monsoon rainfall extremes, Journal of Geophysical Research: Atmospheres 120(2), 496–516, 2015. https://doi.org/10.1002/2014JD022061
Data credits: rainfall data from the India Meteorological Department; city populations from the Census of India 2011; city locations from India-WRIS; state boundaries from the Census of India 2011. Analysis, map and charts: ClimMaTech.