
Hydromet network design: from pilot to state scale
How to grow a hydromet monitoring network in stages, using WMO guidance for station density, tiering and upkeep, and why the first pilot decides more than the last tender.

A state decides to put real-time river and rain gauges across its catchments. The temptation is to write one large tender for several hundred stations and install them all in a single season. Two monsoons later, a third of the stations are silent, nobody is sure who owns the spare batteries, and the control room has data from three formats that do not fit together. Good hydromet network design is mostly about avoiding that outcome, and the surest way is to build in stages. This article explains how a monitoring network grows from a pilot to state scale: what each stage must prove, how many stations a mountainous state needs at the minimum, and what the cost of keeping it running looks like.
Why not install the whole network at once?
A network is more than hardware. It is sensors, power, communication links, a data platform, people who visit the sites, and the users who act on the numbers. A large single-step installation tests all of these for the first time at full scale, when mistakes are most expensive.
The World Bank's review of hydromet modernisation projects lists the usual reasons for limited success. They include a lack of commitment to maintain operations, a preoccupation with installing hardware within the project period without adequate provision for training, maintenance and consumables, and many donors working without coordination, each with its own equipment suppliers [1]. A later World Bank and GFDRR guide says the same from another angle: many development projects focus on getting more observations, but sustaining the capability is difficult, and the benefit of the investment is often short-lived [2].
Staging answers these risks directly. Each stage is small enough to inspect, and each ends with a decision on whether the evidence justifies the next one.
What does a good hydromet network design start with?
It starts with users and decisions, not with a station count. The WMO Guide to Hydrological Practices sets out the steps for designing or reviewing a network: identify the institutions involved, the purposes of the network in terms of users and uses of the data, the objectives in terms of the information required, and the priorities among them. Only then assess existing networks, design, cost the operation against the budget, implement and review [3]. The guide adds that if the budget cannot cover everything, either more funding is found or the objectives are revisited, and that the designer should be able to state the impact of insufficient funding in terms of objectives not met [3].
The WMO Integrated Global Observing System (WIGOS) manual says much the same in its observing network design principles. Networks should respond to stated user requirements for the variables, resolution, uncertainty and timeliness needed, make cost-effective use of resources, be reliable and stable, document metadata "with the same care as the data themselves", be sustainable in the long term, and manage change so that records stay consistent when a system is replaced [4].
For a state flood-warning network, the design questions are concrete:
- Which decisions will the data support: evacuating a village, releasing water from a dam, closing a road, filing a damage claim?
- Which variables does that need: river level, rainfall, discharge, soil moisture?
- How fast must the data arrive, and how accurate must they be for that decision?
- Who visits each site, and with what budget, every year?
The answers become a short written plan. The World Bank guide recommends a Concept of Operations, a document that describes how the future system will work and be sustained, because it gives stakeholders a common understanding before money is spent and makes the operating costs visible [2].
How many stations does a state need at minimum?
The WMO guide gives a starting point. It defines a minimum network as one that avoids serious deficiencies in developing and managing water resources, to be built as rapidly as possible by incorporating existing stations. It stresses that this is a framework for later expansion, not an adequate network for every purpose [3]. Its Table I.2.6 recommends minimum densities (area in km² per station) by physiographic unit. These come from a 1991 review of Members' responses, and the guide says they are a general guideline where no specific guidance exists [3].
| Physiographic unit | Precipitation, non-recording | Precipitation, recording | Streamflow |
|---|---|---|---|
| Mountains | 250 | 2,500 | 1,000 |
| Hilly or undulating | 575 | 5,750 | 1,875 |
| Interior plains | 575 | 5,750 | 1,875 |
| Coastal | 900 | 9,000 | 2,750 |
| Urban areas | – | 10–20 | – |
Area in km² per station [3].
The guide also advises that, in developing networks, at least 10 per cent of precipitation stations should be recorders, concentrated where short, intense rainfall is common [3]. Densities should be adjusted to local socio-economic and physio-climatic conditions [3]. Where few people live, the guide notes that it is almost impossible to operate many stations satisfactorily unless they are highly automated [3].
Worked example: a mountain state of 50,000 km² (illustrative)
Suppose a hill state of about 50,000 km², treated entirely as mountainous for the sake of the arithmetic. This is an illustrative area, not a real state.
Streamflow stations:           50,000 / 1,000 = 50
Non-recording rain gauges:     50,000 / 250   = 200
Recording rain gauges:         50,000 / 2,500 = 20
Check on the 10 % rule:        10 % of 200    = 20 recording gauges
So a WMO-style minimum for this state is about 50 river stations and 220 rain gauges, of which 20 are recording. Real states mix several terrain types and already have stations, which count towards the total. Telemetered river stations in a flood-warning network would usually be chosen from the streamflow stations, and automatic recording rain gauges from the recording set. Our post on how many rain gauges a district needs discusses the rainfall side in more detail.
Note what the density tells you and what it does not. It sizes the whole programme. It does not say where the first stations go, and it does not replace the question of what decision each station serves.
The four stages
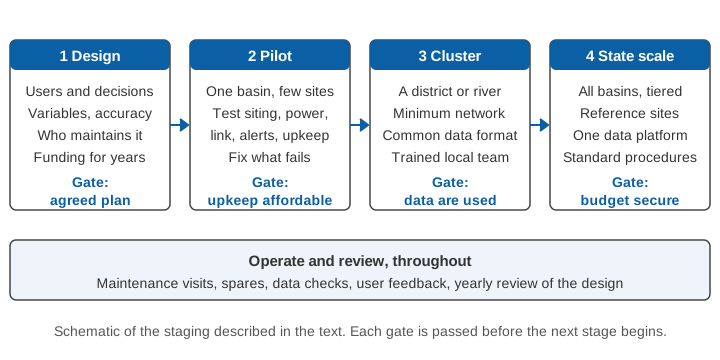
Stage 1: design the network on paper
This is the user, decision and budget work described above. It ends with an agreed plan that names the owners of each station and the money for their upkeep. A design that has no operating budget is not finished. The WIGOS manual notes that sustainability over at least ten years is recommended, and that this depends on paying enough attention to maintenance and operations after the network is built [4].
Stage 2: pilot in one basin
The pilot is a small network in one catchment, with a handful of river and rain stations, a working data platform and a real alert path to real users. Its purpose is learning, not coverage. Test at least these things:
- Siting. Can each station actually be reached in the monsoon? Is the bridge, bank or pole stable? Does the reading represent the river?
- Power and communication. Does each site keep reporting through cloudy spells, floods and network outages? Our posts on keeping stations reporting in floods and on telemetry link design go through the options.
- Data quality. Are spikes, gaps and drift caught automatically? See data quality control for hydromet time series.
- People. Who visits, how long does a visit take, what spares are needed, and what did the first year really cost?
- Use. Do the officers and communities downstream read and act on what arrives? Pilots of the warning chain are especially important where an agency has little experience of using warning systems, as the World Bank guide stresses [2].
Run the pilot through at least one full monsoon, and through a post-monsoon maintenance round, before judging it. Failures that show up at ten stations are cheap lessons. At three hundred stations they become a programme problem.
Gate: the pilot stations run with the routine upkeep the owner can actually afford, and the data reach the users who need them.
Stage 3: extend to a cluster
With the pilot's lessons built into the specification, extend to a district or a whole river system, enough stations to form a minimum network there. Three things now matter more than they did in the pilot.
- One data format and one platform. The World Bank guide stresses the importance of a central system for data management and of data policies that require all equipment suppliers to comply [2]. In practice, agree on units, time stamps, station identifiers and metadata before the second vendor delivers anything. Our post on time stamps you can trust shows how quietly mismatched clocks spoil a record.
- A trained local team. The people who will keep stations alive must be named and trained now, not after handover.
- A written specification built from pilot experience. Our guide to writing a technical specification for a hydromet tender covers how to turn lessons into requirements.
Gate: the cluster produces a record that agencies actually use, with upkeep done on schedule.
Stage 4: scale to the state
Scaling to the state is then largely repetition of a tested pattern, with two additions. The first is a tiered structure. The WIGOS principles say that reference observations of high quality should be used to transfer information to other observations and improve their quality [4], and the WMO guide recommends benchmark stations that give a continuing series of consistent observations, placed in areas little affected by human change [3]. For a state, that means a few well-kept reference stations, with the simpler stations calibrated against them and against periodic gaugings. The second is absorption capacity. The World Bank guide advises assessing the absorption capacity of the institution and scaling the investment accordingly [2]. A department that can service 40 stations well will not service 400 well because the purchase order says so.
Gate: the annual budget covers operation, spares, staff and the yearly review, not only new installations.
What does a network cost to keep running?
Upkeep is where networks fail, so it should be priced at the start. The World Bank guide states that the incremental operation and maintenance costs of a modernised service are, by experience, equivalent to about 10 to 15 per cent of the investment budget, and that many donor-driven projects focused on observation equipment have failed because the agency lacked the staff or resources to maintain it [2]. Adding sophisticated equipment to an institution used to manual stations also raises operating costs and calls for higher-level technical staff than traditional observers [2].
A simple illustration of the arithmetic, using that rule of thumb:
Illustrative investment budget:                 100 units
Incremental O&M at 10-15 % of investment:       10 to 15 units per year
Over the ten-year life suggested in WIGOS [4]:  100 to 150 units
The source does not say whether the percentage is annual; if it is, running a network for a decade costs as much as one to one and a half times its purchase. A budget that funds only the purchase leaves the network unsupported. Our post on the total cost of a monitoring network breaks this down further.
Where does India stand on this?
India's National Hydrology Project is the largest recent programme to build a hydromet network across many states. The World Bank's status report of March 2025 records that, of about 156,000 hydromet stations configured in the national Water Information Management System, about 140,000 had begun sharing data. These include both manual and real-time sensor stations. Real-time data came from 41,000 stations, of which 13,000 were supported through systems outside the project [5]. The numbers show a mix of manual and automatic stations, in which the real-time part is a minority and the platform integrates all of it. For a closer look at the programme, see the National Hydrology Project explained and real-time data acquisition systems in Indian states.
A state can take three practical lessons from this. Real-time telemetry is the part of the network to put where decisions are time-critical, such as river reaches upstream of settlements and dams. Manual and legacy stations still matter, and a good platform takes both. And a hill state faces extra constraints: steep terrain makes siting and access hard, snow and debris affect instruments, and communication may be patchy. Our posts on river monitoring in hill and Himalayan catchments and flash floods versus river floods explain why short warning times in small catchments push stations towards the headwaters.
A checklist of questions before each gate
Before moving from one stage to the next, ask the people running the stations:
- Which stations were offline for more than a week last season, and why?
- How long did it take to repair a fault, from alarm to visit?
- Does the data platform show station health, not just readings?
- Have thresholds been reviewed against actual events? See alarm fatigue and threshold tuning.
- Did a post-monsoon round of checks happen? Our maintenance checklist can serve as a starting point.
- Is next year's operating budget approved?
A network that answers these well at each stage will keep answering them at scale.
Key points
- Build a hydromet network in stages: design, pilot, cluster, state scale, with a review gate after each.
- Start from users and decisions. The WMO guide's design steps run from purposes and objectives to budget, implementation and review [3].
- The WMO guide's minimum density for mountainous areas is one streamflow station per 1,000 km² and one non-recording rain gauge per 250 km², with at least 10 per cent of rain gauges recording [3].
- Pilot through a full monsoon and a maintenance round before scaling. Test siting, power, links, data quality, upkeep and use.
- Budget for operation. The World Bank guide cites incremental O&M of about 10 to 15 per cent of the investment [2].
- Use a tiered design with a few well-kept reference stations, and scale only as fast as the institution can maintain [2][3][4].
Where ClimMaTech fits
At ClimMaTech we build monitoring and warning systems for rivers and catchments, and we favour exactly this staged path: a small first network that proves siting, power, communication and alerts before it grows. The RTDAS and hydromet telemetry page describes how field stations, communication and a data platform fit together, and the flood warning page describes how those readings become alerts for the people downstream.
References
- D. P. Rogers, V. V. Tsirkunov, Weather and Climate Resilience: Effective Preparedness through National Meteorological and Hydrological Services, Directions in Development, The World Bank, 2013. doi:10.1596/978-1-4648-0026-9
- D. P. Rogers, V. V. Tsirkunov, H. Kootval, A. Soares, D. Kull, A.-M. Bogdanova, M. Suwa, Weathering the Change: How to Improve Hydromet Services in Developing Countries?, Global Facility for Disaster Reduction and Recovery (GFDRR), World Bank, 2019. doi:10.1596/31507
- World Meteorological Organization, Guide to Hydrological Practices, Volume I: Hydrology, From Measurement to Hydrological Information, WMO-No. 168, 2008 edition, updated in 2020, section 2.4 and Table I.2.6. Copy hosted by Agência Nacional de Águas, Brazil (hosted copy)
- World Meteorological Organization, Manual on the WMO Integrated Global Observing System, WMO-No. 1160, 2023 edition, updated in 2024, sections 2.2.1 and 2.2.2 and Appendix 2.1. WMO key WIGOS publications
- The World Bank, National Hydrology Project (P152698), Implementation Status and Results Report, archived 28 March 2025. documents1.worldbank.org