
5,513 reservoirs: fewer dry monsoons above India's dams
We traced the catchment of every reservoir in India's national water database and compared its rain in 1979–93 and 2009–23. Most catchments got a little wetter, with fewer dry monsoons and fewer dry years in a row. The exception is the east, where reservoirs in Jharkhand, Bihar and Uttar Pradesh now see about twice as many dry monsoons.

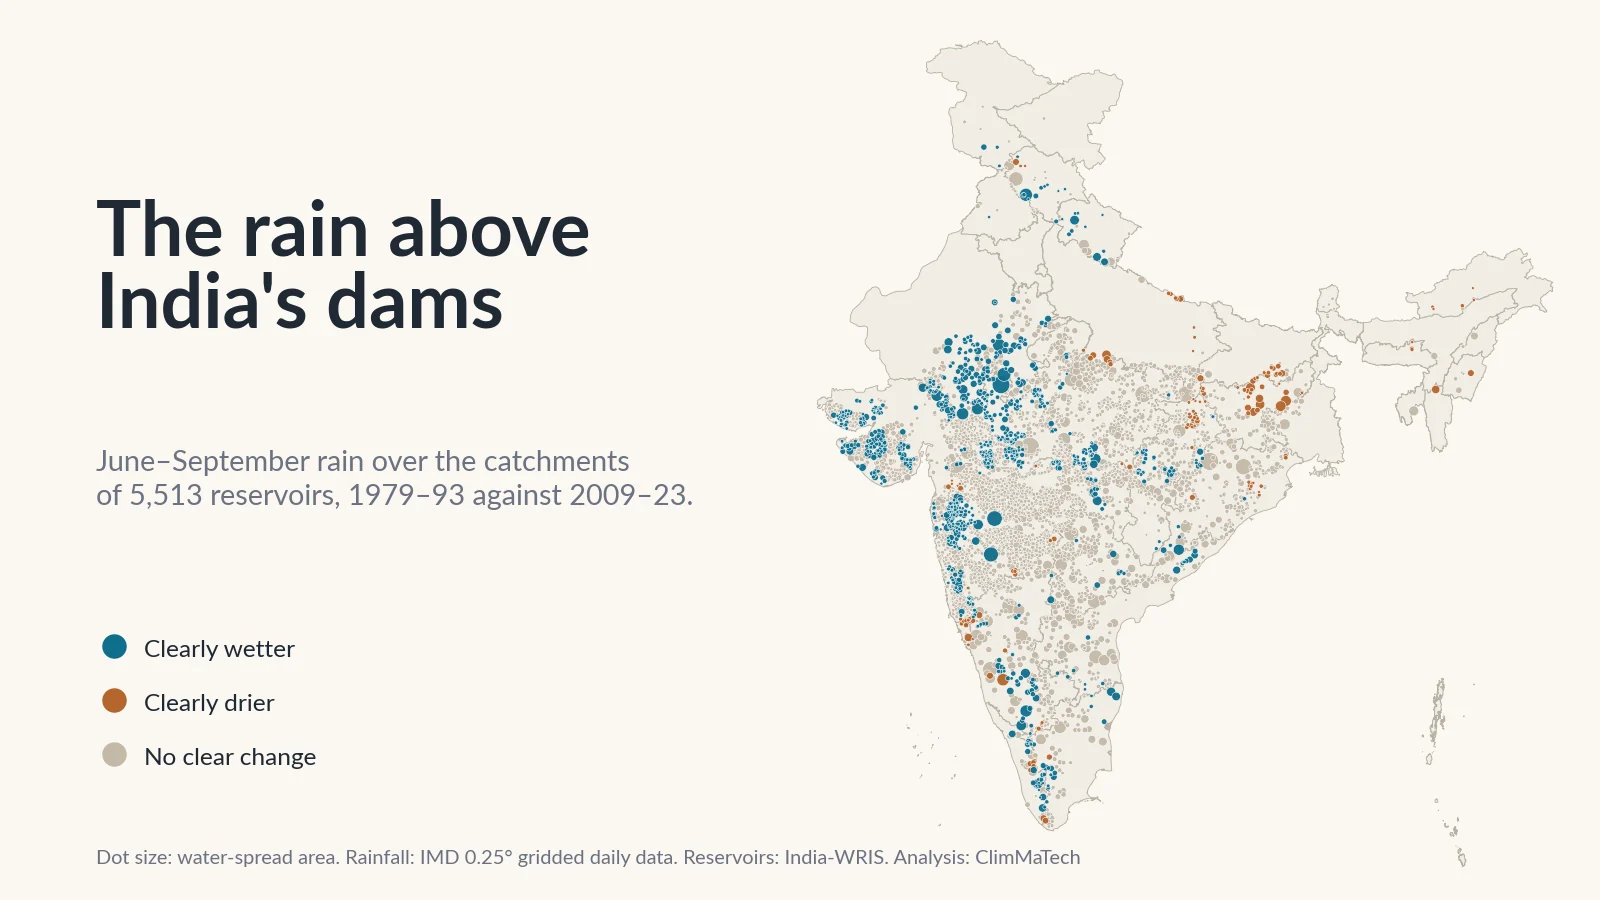
A reservoir lives on the rain that falls on its catchment, the land upstream that drains into it. Its rule curve, the target water levels an operator tries to hold through the year, is drawn from the inflows and floods of the past. So is the yield a city or an irrigation scheme is promised. If the rain over the catchment has changed since those numbers were set, the reservoir is being run on an old climate.
Has the rainfall over India's reservoir catchments changed? To find out, we traced the catchment of every reservoir in India-WRIS, the national water resources information system, and compared 45 years of the India Meteorological Department's (IMD) daily rainfall over each one. The layer lists 5,554 reservoir records. Two are duplicates, and 39 reservoirs could not be analysed, mostly because the rainfall grid covers too little of their catchment or shows signs of a change in its gauges. That leaves 5,513.
The short answer is that, on this record, the monsoon over India's reservoirs has become a little more generous, not less. Averaged over all 5,513 catchments, June–September rain rose from about 874 mm in 1979–93 to 938 mm in 2009–23. Dry monsoons, the years a catchment gets less than four-fifths of its normal monsoon rain, became less frequent, and so did runs of dry years. Days of heavy rain rose slightly. The largest storms of the year, measured over three and five days, hardly changed on average.
The exception is the east. In the reservoirs of Jharkhand, Bihar, Uttar Pradesh and West Bengal, monsoon rain fell by about a tenth and dry monsoons became about twice as common.
How we looked
The reservoirs. India-WRIS publishes a reservoir layer: the outline of each water body, with its name, state and river basin [1]. Most of these reservoirs are small. The median water-spread area is 48 hectares (ha), and 3,825 of the 5,552 distinct reservoirs cover less than 100 ha. Only 35 cover 10,000 ha or more. Our case study on India's ageing dams looked at the dams themselves; here the subject is the water behind them and the land that feeds it.
The catchments. For each reservoir we started from its dam, as located in India-WRIS's dam layer, and delineated all the land that drains to it with INCLINE, the watershed delineation system developed at IIT Mandi [2]. It is the method explained in catchments and watersheds, done for every reservoir. A reservoir's catchment includes the catchments of every reservoir upstream of it. INCLINE follows mapped rivers, not the smallest streams, so most small tanks have no river at their dam that it can start from. For those we traced the catchment on HydroSHEDS, a coarser 460 m flow grid [3], starting from the reservoir's outline. INCLINE gives the catchment of 1,708 of the 5,513 reservoirs we analysed, including 295 of the 310 that cover 1,000 ha or more; HydroSHEDS gives the rest. Where both are available, the two areas agree to within 3% for half of the reservoirs.
The rain. IMD's gridded daily rainfall turns readings from thousands of rain gauges into cells 0.25° (about 25 km) across, one value per cell per day [4][5]. We used 1 January 1979 to 31 December 2023. Each catchment's daily rain is the area-weighted average of the grid cells it covers.
What we measured. For each catchment and each year:
- Monsoon rain: the June–September total, and the annual total.
- Dry and wet monsoons: a year whose June–September rain is below 80% or above 120% of the catchment's 1979–2023 average. These match the edges of IMD's "deficient" (20% to 59% below normal) and "excess" (20% to 59% above) categories for districts [6]. Our post on how IMD classifies monsoon rainfall explains the scale.
- Dry monsoons in a row: whether a 15-year period contains two or more consecutive dry monsoons. A reservoir that does not refill one year starts the next one low.
- Heavy-rain days: days with 64.5 mm or more, IMD's threshold for heavy rain [7], counted cell by cell and averaged over the catchment.
- The wettest 1, 3 and 5 days of the year: the largest catchment-average rain over one, three and five consecutive days. These are the totals that fill a reservoir in a flood.
- The longest monsoon dry spell: the longest run of days with less than 2.5 mm between June and September, as in our case study on monsoon dry spells.
- Year-to-year swing: how far each monsoon departs from the period's typical value.
Then and now. As in our earlier case studies, we compared two 15-year periods a generation apart, 1979–1993 and 2009–2023, and called a change clear only when the difference between the two averages is at least twice its standard error. We also ran trend tests over all 45 years. The details are in the Method section at the end.
Has the rain over India's reservoir catchments changed?
On average, it has increased a little. June–September rain was higher in 2009–23 than in 1979–93 for 3,709 of the 5,513 reservoirs (67%), and the median catchment gained 8%. For 957 reservoirs the rise is clear; for 150 there is a clear fall. Our two-standard-error rule passes about 2.7% of catchments each way by chance, about 149 reservoirs, so the rises are far more than chance would give and the falls about what it would give.
The other measures point the same way:
- Dry monsoons became rarer. A reservoir's catchment had on average 4.6 dry monsoons in 1979–93 and 3.6 in 2009–23. In 585 catchments the fall is clear; in 215 there is a clear rise.
- Wet monsoons became more common, from 2.8 to 4.1 in 15 years. 622 catchments clearly gained wet years.
- Heavy-rain days rose slightly, from 2.0 to 2.25 a year on average, clearly in 448 catchments and clearly down in 199.
- The biggest multi-day totals hardly moved. The year's wettest three days averaged 154 mm in 1979–93 and 157 mm in 2009–23. Clear rises (230) and clear falls (216) are almost balanced, and both are only modestly above the 149 that chance would give.
- Monsoon dry spells got shorter, from 18.5 days to 16.2 at their longest. 643 catchments clearly shortened and 26 clearly lengthened.
- The monsoon is not more erratic. The typical year-to-year swing in monsoon rain stayed at about 25% of the period's typical value, and fewer catchments changed clearly than chance alone would produce.
The trend tests over all 45 years agree. Reservoirs share catchments, and small tanks inside one grid cell share the same rain, so we counted 3,646 distinct rainfall series. After correcting for testing thousands of them [8][9][10][11], 125 series keep a significant rise in monsoon rain and 28 a significant fall. For the longest dry spell, 96 keep a significant shortening and 2 a lengthening.
Reservoir catchments do not look like India as a whole here. Across all of India's usable grid cells, 16% have clearly more monsoon rain and 13% clearly less. Among reservoir catchments, the figures are 17% and 3%. Most reservoirs in the layer lie in Maharashtra, Madhya Pradesh, Gujarat and the south, where catchments mostly gained; only 229 lie in Jharkhand, Bihar, Uttar Pradesh and West Bengal.
How often does a dry monsoon strike many reservoirs at once?
In 1987, 3,331 of the 5,513 catchments, 60%, got less than 80% of their normal monsoon rain. Five years between 1982 and 1987 left at least 40% of the catchments dry. In 2009–23, four years did: 2009, 2014, 2015 and 2018.
A dry year is rarely local. When one reservoir fails to fill, its neighbours are likely to be short as well, so water cannot simply be borrowed from the next scheme.
The early period contained the run of poor monsoons of the mid-1980s, and that matters for a comparison like ours. So we also looked at the 15 years in between, 1994–2008. A catchment then had on average 4.4 dry monsoons, close to the early period, and 2009–23 still had clearly fewer than 1994–2008 in 473 catchments, against 158 with clearly more. The fall in dry monsoons is not only a memory of the 1980s; it is mostly a feature of the last 15 years.
Fewer dry years in a row, except in the east
For a reservoir, two dry monsoons in a row are worse than two apart: one that ends a monsoon low may enter the next one nearly empty.
In 1979–93, 3,714 reservoirs had at least two dry monsoons in a row in their catchment. In 2009–23, 2,764 did. Runs of three or more fell further, from 2,016 reservoirs to 509.
Gujarat shows the largest change: 95% of its reservoirs had back-to-back dry monsoons in 1979–93 and 38% in 2009–23. Rajasthan fell from 79% to 28% and Andhra Pradesh from 74% to 35%. Maharashtra, with 2,110 of the reservoirs, fell from 78% to 57%.
Uttar Pradesh went the other way, from 27% of its reservoirs to 93%. Across Jharkhand, Bihar, Uttar Pradesh and West Bengal, 229 reservoirs, the number with back-to-back dry monsoons rose from 79 to 195.
Where has the rain over reservoirs clearly changed?
Teal dots on the map have clearly more of the selected measure over their catchment, brown dots clearly less. Tap a dot to see both periods, or search for a reservoir by name.
A wetter west: Gujarat, Rajasthan and western Madhya Pradesh
The largest gains are in the drier west. In the catchments of the West-flowing rivers of Kutch and Saurashtra, monsoon rain averaged about 500 mm in 1979–93 and 725 mm in 2009–23, and every one of the 202 clear changes there is a rise. Dry monsoons there fell from 7.7 in 15 years to 3.6. The Sabarmati and Mahi basins and the reservoirs of south-eastern Rajasthan show the same shift: Gandhi Sagar's catchment went from about 750 mm to 980 mm, Ranapratap Sagar's from 744 mm to 971 mm and Bisalpur's from 535 mm to 679 mm.
The Western Ghats of Maharashtra
The reservoirs north and east of Mumbai have the largest rises in heavy rain. Over the catchment of Upper Vaitarna, heavy-rain days went from about 5.4 a year to 12.1, and the year's wettest three days from 261 mm to 375 mm. Vaitarna, Bhatsa, Gangapur, Darna and Mukane show similar rises. Further inland, Ujjani's catchment went from about 620 mm of monsoon rain to 794 mm, and Jayakwadi's from 531 mm to 670 mm.
This is also where the grid is least steady. Thirty reservoirs, 21 of them in Maharashtra, had to be set aside because their catchment's annual rain halves or doubles between the two periods; around Upper Ghatghar, for example, it goes from about 700 mm a year to 1,427 mm. A change that size points to a change in the gauges behind the grid, not in the rain. The rises around Mumbai are large but not that large, and a second dataset agrees with their direction (see below), but individual values in this belt deserve a check against the gauges.
A drier east: the Damodar valley, Rihand and Bundelkhand
Across Jharkhand, Bihar, Uttar Pradesh and West Bengal, average monsoon rain over reservoir catchments fell from about 965 mm to 855 mm. Fifty-four of these 229 reservoirs became clearly drier and none clearly wetter. Dry monsoons rose from 2.6 in 15 years to 5.5, and the rise is recent: in 1994–2008 the figure was 2.9.
The Damodar valley reservoirs are typical. Over the catchment of Maithon, monsoon rain fell from about 1,070 mm to 814 mm; over Tilaiya from 1,100 mm to 793 mm; over Panchet from 1,055 mm to 865 mm. Rihand (Gobind Ballabh Pant Sagar), one of the largest reservoirs in the layer, had one dry monsoon in 1979–93 and seven in 2009–23.
India's largest reservoirs
Most of the largest reservoirs show modest changes. Here are the 20 largest by water-spread area in the layer that we could analyse, with our catchment area beside the published one. Rainfall values are catchment averages per year:
| Reservoir | State | Catchment (km²) | Published catchment area (km²) | June–Sept rain, mm | Dry monsoons in 15 years | Heavy-rain days | Wettest 3 days, mm |
|---|---|---|---|---|---|---|---|
| Indira Sagar | Madhya Pradesh | 62,468 | 61,642 [12] | 1,046 → 1,147 | 2 → 0 | 2.3 → 2.6 | 137 → 139 |
| Hirakud | Odisha | 84,829 | 83,395 [13] | 1,071 → 1,085 | 1 → 1 | 1.9 → 2.1 | 101 → 122 (clear) |
| Gandhi Sagar | Madhya Pradesh | 22,840 | 23,025 [13] | 750 → 981 (clear) | 5 → 3 | 1.9 → 2.5 | 130 → 161 |
| Ukai | Gujarat | 62,030 | 62,225 [13] | 692 → 731 | 5 → 0 (clear) | 1.2 → 1.1 | 82 → 91 |
| Ban Sagar | Madhya Pradesh | 18,671 | – | 1,012 → 975 | 1 → 4 | 1.8 → 1.5 | 126 → 132 |
| Rengali | Odisha | 25,289 | 25,250 [13] | 1,118 → 1,062 | 1 → 1 | 1.7 → 1.8 | 107 → 128 (clear) |
| Gobind Ballabh Pant Sagar/Rihand | Uttar Pradesh | 12,817 | 13,333 [13] | 1,053 → 911 | 1 → 7 (clear) | 1.6 → 1.2 | 136 → 120 |
| Srisailam | Andhra Pradesh | 210,546 | 206,030 [13] | 547 → 588 | 2 → 3 | 0.9 → 0.9 | 53 → 55 |
| Almatti | Karnataka | 33,744 | 35,925 [13] | 658 → 702 | 2 → 3 | 1.2 → 1.2 | 76 → 89 |
| Jayakwadi | Maharashtra | 22,206 | 21,774 [13] | 531 → 670 (clear) | 5 → 3 | 0.7 → 1.1 (clear) | 85 → 83 |
| Linganamakki | Karnataka | 2,002 | 1,992 [13] | 2,156 → 2,690 | 4 → 2 | 8.0 → 11.8 | 237 → 315 (clear) |
| Sriram Sagar | Telangana | 90,106 | 54,054 [13] | 691 → 703 | 4 → 4 | 1.1 → 1.1 | 85 → 81 |
| Ujjani | Maharashtra | 15,000 | 14,858 [13] | 620 → 794 (clear) | 8 → 4 | 1.1 → 1.7 | 87 → 91 |
| Rani Avanti Bai Sagar (Bargi) | Madhya Pradesh | 15,069 | 14,556 [13] | 1,087 → 1,112 | 2 → 1 | 1.8 → 1.8 | 126 → 123 |
| Pong | Himachal Pradesh | 12,604 | 12,562 [13] | 904 → 938 | 4 → 2 | 2.4 → 2.0 | 119 → 112 |
| Somasila | Andhra Pradesh | 51,406 | – | 375 → 415 | 8 → 2 (clear) | 0.8 → 0.8 | 71 → 75 |
| Ranapratap Sagar | Rajasthan | 25,059 | 25,305 [13] | 744 → 971 (clear) | 5 → 3 | 1.8 → 2.4 | 127 → 157 |
| Rani Laxmi Bai Sagar (Rajghat Dam) | Madhya Pradesh | 16,792 | 16,317 [13] | 982 → 1,099 | 4 → 2 | 2.3 → 2.7 | 160 → 169 |
| Nagarjuna Sagar | Telangana | 219,823 | 215,185 [13] | 543 → 585 | 2 → 3 | 0.9 → 0.9 | 53 → 54 |
| Tawa | Madhya Pradesh | 5,976 | 5,983 [13] | 1,201 → 1,332 | 3 → 4 | 3.1 → 3.4 | 209 → 224 |
"Clear" marks a change of at least twice its standard error. Our areas are delineated with INCLINE; published areas are from the Central Water Commission [13] and, for Indira Sagar, NHPC [12]; – means we found no published figure in a primary source. Most pairs agree within 7%. Sriram Sagar is the exception: the published 54,054 km² is far below our 90,106 km². It cannot be the whole catchment, because the Manjra and Purna, which join the Godavari above the dam, drain about 30,800 km² and 15,600 km² [14], and Jayakwadi upstream on the Godavari itself has 21,774 km² [13]. Some published figures count only the area below the next dams upstream, and this may be one, but the source does not say.
Hirakud and Rengali in Odisha stand out for flood handling: the year's wettest three days over their catchments rose clearly, from about 101 mm to 122 mm and from 107 mm to 128 mm. Linganamakki in Karnataka rose from 237 mm to 315 mm.
How far can we trust this?
A second dataset. The gauge network behind IMD's grid changes over time, and changes in which stations report have been shown to shift its statistics [15]. So we repeated the comparison with IMDAA, a regional reanalysis that reconstructs the weather with a forecast model [16][17] and does not depend on the same gauges. IMDAA ends in 2020, so both datasets were compared for 1979–93 and 2006–20. Of the 802 reservoirs whose annual catchment rain rises clearly in IMD's grid over those years, 797 also get wetter in IMDAA. Of the 130 that fall clearly, only 41 also get drier in IMDAA. Our own comparison of these datasets found that IMDAA runs wetter than IMD over much of the north and east (India's rainfall datasets agree on seasons, not storms), so its size of change is not a check on IMD's. But the wetter monsoon over most reservoirs holds in both. The drying in the east is seen only in the gauge-based grid and should be treated as less certain.
Rain is not inflow. A catchment that got 8% more monsoon rain did not necessarily send 8% more water into its reservoir. Runoff depends on soil moisture, groundwater, land use, the check dams, tanks and wells upstream, and releases from reservoirs upstream. Turning rain into inflow takes a rainfall–runoff model (see hydrological models explained) and observed flows to check it against. Most of these catchments have no gauged flow record at all. In our work on streamflow across 144 Indian watersheds, we built a deep-learning model that can estimate flow in ungauged basins [18], but any such model is only as good as the rain fed into it.
Small tanks see one grid cell. The median catchment in the layer covers only 18 km². For 3,010 of the 5,513 reservoirs, the whole catchment lies inside a single 25 km grid cell, so its "catchment rain" is simply that cell's rain. For these tanks the map describes the rain of the surrounding area, not of the hillside that drains into the tank. The 310 reservoirs of 1,000 ha or more have a median catchment of about 920 km² and are better served.
Catchments are approximate. No river network follows every canal, diversion or embankment. The small tanks without an INCLINE catchment rely on a 460 m flow grid, on which a tank next to a larger river can be linked to the wrong channel.
Reservoirs inside reservoirs. For 757 reservoirs (14%), at least one other reservoir in the layer lies upstream, and for 204 more than half of the catchment drains through an upstream reservoir first. Polavaram, on the lower Godavari, has 1,193 of them. For such reservoirs, the rain over the catchment says less about the inflow than the release decisions upstream.
What does this mean for reservoir operators?
In India, the guideline for drawing a dam's rule curve is IS 7323. It says that rule curves, once prepared, "should be constantly reviewed and, if necessary, modified" [19]. A change in the rain over the catchment is one reason to review them. Our results are a reason to check that with recent data, not an argument that any particular rule curve is wrong.
In most of the west and south, the old record may now be conservative for refill. If the rule curves, yields and allocations of a reservoir in Saurashtra, Rajasthan or western Madhya Pradesh were set on records dominated by the dry 1980s, the reservoir now sees fewer dry monsoons than that record implies. That does not make the water safe to over-allocate. Storage is also being lost to sediment year by year (see why Indian reservoirs lose storage), and demand grows. But it is a reason to revisit the numbers with the recent record rather than the old one.
More wet monsoons mean more years that end with a full reservoir and a flood to pass. Wet monsoons, above 120% of normal, rose from 2.8 to 4.1 in 15 years on average. A reservoir that is already full when a big storm arrives must pass the flood through its spillway. How gates should be operated in that situation, and why it needs real-time data, is set out in our post on dam spillways and gates.
Multi-day storms matter more than single days. A flood that fills a reservoir is usually the product of several days of rain over the whole catchment. Nationally, the wettest three- and five-day totals have not grown, but in particular catchments they have: by about a fifth at Hirakud and Rengali, by a third at Linganamakki and by more than 40% over Upper Vaitarna. These are exactly the reservoirs where inflow forecasting, early drawdown and coordinated gate operation pay off. Design floods themselves are normally estimated on the assumption that the statistics of extremes do not change over time. In our review of methods for flood frequency analysis when that assumption fails [20], we concluded that changing statistics need to be built into flood risk assessment.
In the east, plan for refill risk. In the Damodar valley, around Rihand and across eastern Uttar Pradesh and Bihar, dry monsoons have roughly doubled, and back-to-back dry years have become common. Rule curves set on 1980s and 1990s inflows may now assume a refill that comes less often. If the eastern drying is confirmed by the gauges themselves, it is the strongest case in our results for revising operation rules.
What would help
- Measure the rain on the catchment, not near it. A grid cell 25 km across cannot resolve a catchment of 18 km². Recording rain gauges inside the catchment, reporting in real time, show what it actually receives, storm by storm.
- Measure the river before it reaches the reservoir. Water-level and discharge stations on the main inflowing rivers turn catchment rain into what matters, the inflow, and give the hours of warning that gate operation needs. Without them, inflow can only be worked out from the change in reservoir level, after the water has arrived.
- Measure the reservoir level continuously. Level, recorded every few minutes rather than read by eye once or twice a day, gives the operator inflow and storage in real time. Our post on reservoir level monitoring explains what to measure and why.
- Update operation rules with the recent record. Recompute dry-year frequencies, refill probabilities and flood volumes from the last 15–30 years, catchment by catchment, and check whether the rule curve still fits.
- Warn the people downstream. When a full reservoir must release a flood, the people below it need to know in time, through sirens and voice messages in their own language as well as phones.
Key points
- We delineated the catchment of every reservoir in the India-WRIS layer and analysed 5,513 of them with IMD's daily rainfall, 1979–93 against 2009–23.
- Monsoon rain over reservoir catchments rose on average from about 874 mm to 938 mm. It rose clearly for 957 reservoirs and fell clearly for 150, about what chance alone would give.
- Dry monsoons (below 80% of normal) fell from 4.6 to 3.6 in 15 years per reservoir, and reservoirs with two or more dry monsoons in a row fell from 3,714 to 2,764. Wet monsoons rose from 2.8 to 4.1.
- The east is the exception: across Jharkhand, Bihar, Uttar Pradesh and West Bengal, monsoon rain fell by about a tenth and dry monsoons roughly doubled. A reanalysis does not confirm this drying, so it needs checking against the gauges.
- The largest three- and five-day rain totals have not grown nationally, but have grown sharply over some reservoirs, including Hirakud, Rengali, Linganamakki and Upper Vaitarna.
- In a bad year a dry monsoon is national: in 1987, 60% of reservoir catchments had one.
- Most catchments are small; for 3,010 reservoirs the whole catchment lies within one 25 km grid cell. Rain is not inflow, and only measurements in the catchment can show what a reservoir actually receives.
At ClimMaTech we build instruments for measuring water where these decisions are made. Tarang, our radar automatic water level recorder (AWLR), records reservoir and river levels continuously, and PRAVAAH combines an AWLR with a surface velocity radar (SVR) to measure the discharge of inflowing rivers without touching the water, using a surveyed cross-section and a site-calibrated coefficient. Rakshak is a multi-hazard warning siren with 15–20 user-selectable siren tones and voice messages, for flood releases, other disasters and civil-defence warnings. Our dam and reservoir solution shows how they fit together.
Method
Rainfall data: IMD 0.25° × 0.25° gridded daily rainfall [4][5], 1 January 1979 to 31 December 2023 (16,436 days). IMD provides the data for download, asks users to cite Pai et al. (2014) and states that it cannot guarantee the data are correct in all circumstances [5]. A cell is usable if it has a complete record in at least 40 of the 45 years; 4,964 cells are. Only usable cells enter catchment averages.
Reservoirs: India-WRIS reservoir layer [1]: 5,554 water-spread polygons with name, state and a code whose first two characters give the river basin in India's 20-basin scheme. Two records (Mes Dam and Dhanikhari Dam, Andaman and Nicobar Islands) are exact duplicates, leaving 5,552 reservoirs. State codes that are variants of one state were merged.
Catchments, INCLINE: delineated with INCLINE, the watershed delineation system developed at IIT Mandi [2]. Outlet: each WRIS dam point linked to the reservoir (the nearest reservoir outline within 1 km; 5,194 reservoirs have one), or, for the 358 without, the HydroSHEDS polygon outlet described below. The point was snapped to the nearest mapped river within 300 m, then within 1 km; only then to the largest river within 1 km (and, for reservoirs of 1,000 ha or more, within 3 or 5 km). A delineation was accepted only if its area was within 25% of the HydroSHEDS area for reservoirs of 1,000 ha or more, or within a factor of three for smaller ones, so that a tank cannot jump onto a large river nearby. Of 5,552 reservoirs, 1,724 have an accepted INCLINE catchment (1,305 at 300 m, 311 at 1 km, 95 from the polygon outlet, 13 from the largest river). For the 3,828 others, mostly tanks with catchments under 50 km² that have no mapped river within reach, the HydroSHEDS catchment is used. Before the plausibility test, the first INCLINE delineation at the dam agreed with HydroSHEDS within 25% at 1,250 of the 1,371 reservoirs where it found a river within 300 m (median difference 2.5%). Each catchment polygon was intersected with the IMD grid to give the area in each cell. Nesting: a reservoir is upstream of another if its outlet lies inside the other's catchment and its catchment is smaller.
Catchments, HydroSHEDS: HydroSHEDS v1 flow directions and flow accumulation at 15 arc-seconds [3], which are free for non-commercial and commercial use under the HydroSHEDS licence, with citation of Lehner et al. (2008) [3]. Outlet: the cell with the largest flow accumulation among the cells whose centre lies inside the reservoir polygon (4,837 reservoirs), or among the cells the polygon touches if it contains no cell centre (715). The outlet is taken from the water body itself, so no search radius is needed. Every cell in a window from 66° E to 100° E and 5° N to 38° N was then linked to the first reservoir outlet downstream of it by repeatedly following flow directions. This gives each reservoir's own (incremental) catchment and the tree of nested reservoirs; a reservoir's full catchment is its own catchment plus the full catchments of the reservoirs directly upstream. A reservoir can drain out of its outline along more than one flow path on a 460 m grid; every other cell inside the outline whose flow leaves it, and whose upstream area is at least 10% of the main outlet's, was kept as an extra outlet, and the reservoir's catchment is the union of its outlets' catchments (1,347 reservoirs have extra outlets; for 625 they add area beyond the main outlet's catchment). For all 7,856 outlet cells, the number of traced cells equals HydroSHEDS's flow accumulation. Catchment areas used range from 0.18 km² to 306,631 km² (Polavaram); the median is 18.4 km².
Our and published catchment areas: our areas are delineated from satellite elevation data, so they can differ from published areas, which usually come from survey maps or project reports. For the 31 large reservoirs where we found a Central Water Commission or project figure [13][12], the median difference is 2.2% for INCLINE and 2.7% for HydroSHEDS. At Hirakud, INCLINE gives 84,829 km² from the dam point, against the 83,395 km² published by the Central Water Commission [13]. On the coarser HydroSHEDS grid a second arm of the reservoir leaves its outline beside the dam, so the outlet inside the outline alone gives only about 72,500 km²; joining that arm gives 85,170 km². Sriram Sagar is the one large disagreement (see the note to the table).
Catchment rainfall: for each catchment, the area of each IMD cell it covers was used as a weight; the catchment's daily rain is the weighted mean of its usable cells. Coverage is the share of the catchment's area in usable cells. Analysed: coverage of at least one half, and annual catchment rain that neither halves nor doubles between the two periods. Not analysed: four reservoirs in the Andaman and Nicobar Islands (no grid), five with coverage below one half (among them Nathpa Jhakri and Karcham Wangtoo, whose catchments extend into Tibet), and 30 whose annual rain halves or doubles (21 in Maharashtra, four in Tamil Nadu, three in Meghalaya including Umiam, one each in Karnataka and Kerala). For 159 reservoirs in Gujarat, the 2023 data have missing days over the catchment, so their 2009–23 values use 14 years.
Measures, per catchment and calendar year: June–September and annual totals; dry monsoon (June–September total below 80% of the catchment's 1979–2023 mean) and wet monsoon (above 120%); two or more consecutive dry monsoons within a 15-year period; heavy-rain days (64.5 mm or more [7]), counted in each cell and averaged over the catchment with area weights; the largest catchment-average total over 1, 3 and 5 consecutive days within the year, after capping any cell-day that no neighbouring cell supports (none of its eight neighbours had at least half as much) at twice the largest neighbouring value, as in our wettest-days study; the longest run of days below 2.5 mm in June–September, per cell, averaged over the catchment; and the year-to-year swing, the mean absolute departure of each June–September total from the period's median, as a percentage of that median.
Clear change: the difference between the 2009–2023 and 1979–1993 means is at least twice its standard error, SE = √(s₁²/15 + s₂²/15), from the catchment's own yearly values. For dry and wet monsoons, the yearly values are 1 or 0. Applied to the absolute departures, the rule is a test of a change in spread. Shuffling the 30 years between the two periods 100 times for each distinct rainfall series showed that the rule passes 2.6–2.7% of series each way by chance on each of the four measures we tested (monsoon rain, dry monsoons, heavy-rain days and wettest 3 days). A middle period, 1994–2008, was used as a sensitivity check.
Trend tests: Mann–Kendall test [8] with tie correction and Sen's slope [9] on each distinct catchment rainfall series, 1979–2023. Reservoirs whose catchments have the same usable-cell weights (to 1%) share one series; there are 3,646 distinct series among the 5,513 reservoirs. False discovery rate controlled with the Benjamini–Hochberg procedure [10] at 0.10, as recommended by Wilks [11]. The tests do not correct for serial correlation.
Cross-check: annual totals from the IMDAA reanalysis [16], regridded conservatively onto the IMD grid, averaged over each catchment with the same weights, 1979–1993 against 2006–2020. IMDAA is distributed by the National Centre for Medium Range Weather Forecasting (NCMRWF) under a CC-BY licence. As NCMRWF asks, we acknowledge that the IMDAA reanalysis was produced under the collaboration among NCMRWF, the UK Met Office and IMD with financial support from the Ministry of Earth Sciences under the National Monsoon Mission programme [17].
Caveats: A 0.25° daily grid smooths out short and local rain, and for most small tanks the catchment average is the value of one cell. The gauge network behind the grid changes over time [15]. Catchments are approximate, especially the small ones traced on the 460 m grid, and ignore canals, diversions and inter-basin transfers. Rainfall is not inflow. Nested reservoirs and reservoirs in the same grid cell are not independent, so counts of reservoirs overstate the number of independent results. The India-WRIS layer does not include every reservoir and carries no information on capacity, purpose or operation. Comparing two 15-year periods does not separate long-term change from decadal variability. Maps are approximate and not to scale.
References
- India-WRIS, Ministry of Jal Shakti, Reservoirs (water body layer). https://indiawris.gov.in/wris/
- INCLINE watershed delineation system, IIT Mandi, 2026; river network from GRIT (Wortmann et al., 2025, Water Resources Research, doi:10.1029/2024WR038308; CC BY-NC 4.0). https://incline.iitmandi.ac.in
- Lehner, B., Verdin, K. and Jarvis, A., New global hydrography derived from spaceborne elevation data, Eos, Transactions American Geophysical Union 89(10), 93–94, 2008. Data and licence: HydroSHEDS Technical Documentation v1.4, Appendix A. https://doi.org/10.1029/2008EO100001 ; https://www.hydrosheds.org
- Pai, D.S., Sridhar, L., Rajeevan, M., Sreejith, O.P., Satbhai, N.S. and Mukhopadhyay, B., Development of a new high spatial resolution (0.25° × 0.25°) long period (1901–2010) daily gridded rainfall data set over India and its comparison with existing data sets over the region, Mausam 65(1), 1–18, 2014. https://doi.org/10.54302/mausam.v65i1.851
- India Meteorological Department, Pune, High resolution (0.25 × 0.25 degree) gridded daily rainfall data (NetCDF), IMD. https://www.imdpune.gov.in/cmpg/Griddata/Rainfall_25_NetCDF.html
- India Meteorological Department, Hydromet Division, District Rainfall Distribution (daily report; legend: excess +20% to +59%, normal −19% to +19%, deficient −20% to −59%), New Delhi, updated daily. https://mausam.imd.gov.in/Rainfall/DISTRICT_RAINFALL_DISTRIBUTION_COUNTRY_INDIA_cd.pdf
- India Meteorological Department, RSMC New Delhi, Press release, 2 March 2022 (legend of rainfall intensity terms: heavy 64.5–115.5 mm, very heavy 115.6–204.4 mm, extremely heavy above 204.4 mm), IMD, 2022. https://rsmcnewdelhi.imd.gov.in/uploads/archive/8/8_605370_Press%20Release%2002.03.2022_1.pdf
- Mann, H.B., Nonparametric tests against trend, Econometrica 13(3), 245–259, 1945. https://doi.org/10.2307/1907187
- Sen, P.K., Estimates of the regression coefficient based on Kendall's tau, Journal of the American Statistical Association 63(324), 1379–1389, 1968. https://doi.org/10.1080/01621459.1968.10480934
- Benjamini, Y. and Hochberg, Y., Controlling the false discovery rate: a practical and powerful approach to multiple testing, Journal of the Royal Statistical Society Series B 57(1), 289–300, 1995. https://doi.org/10.1111/j.2517-6161.1995.tb02031.x
- Wilks, D.S., "The stippling shows statistically significant grid points": how research results are routinely overstated and overinterpreted, and what to do about it, Bulletin of the American Meteorological Society 97(12), 2263–2273, 2016. https://doi.org/10.1175/BAMS-D-15-00267.1
- NHPC Limited, Indira Sagar (JV) (project page, in Hindi: total catchment area of the dam site 61,642 km²). https://www.nhpcindia.com/welcome/language/en/project_detail/23/2/
- Central Water Commission, Watershed and Reservoir Sedimentation Directorate, Compendium on Sedimentation of Reservoirs in India, Ministry of Jal Shakti, 2020 (reservoir data sheets and annexure tables, catchment area in km²). https://cwc.gov.in/sites/default/files/compendium1122020.pdf
- Godavari Water Disputes Tribunal, The Report of the Godavari Water Disputes Tribunal (with the decision), Volume I, New Delhi, 1979 (catchment of the Manjra and its tributaries 11,909 sq. miles; of the Purna 6,015 sq. miles). https://dspace.gipe.ac.in/xmlui/handle/10973/52277
- Lin, M. and Huybers, P., If rain falls in India and no one reports it, are historical trends in monsoon extremes biased?, Geophysical Research Letters 46(3), 1681–1689, 2019. https://doi.org/10.1029/2018GL079709
- Rani, S.I., Arulalan, T., George, J.P., Rajagopal, E.N., Renshaw, R., Maycock, A., Barker, D.M. and Rajeevan, M., IMDAA: High resolution satellite-era reanalysis for the Indian monsoon region, Journal of Climate 34(12), 2021. https://doi.org/10.1175/JCLI-D-20-0412.1
- National Centre for Medium Range Weather Forecasting, RDS data portal: IMDAA regional reanalysis, 1979–2020 (terms of use and acknowledgement). https://rds.ncmrwf.gov.in/
- Barbhuiya, S. and Gupta, V., From gauged to ungauged: large-scale deep learning rainfall-runoff modelling for reliable streamflow estimation in India's diverse basins, Environmental Modelling & Software 194, 106696, 2025. https://doi.org/10.1016/j.envsoft.2025.106696
- Bureau of Indian Standards, IS 7323:1994 Operation of reservoirs – guidelines (first revision), New Delhi, November 1994, reaffirmed 1999 (clause 5.0) (archived copy). https://archive.org/details/gov.in.is.7323.1994
- Barbhuiya, S., Ramadas, M. and Biswal, S.S., Nonstationary flood frequency analysis: review of methods and models, in River, Sediment and Hydrological Extremes: Causes, Impacts and Management, Disaster Resilience and Green Growth, Springer, 271–288, 2023. https://doi.org/10.1007/978-981-99-4811-6_15
Data credits: rainfall data from the India Meteorological Department and NCMRWF (IMDAA); reservoirs and dams from India-WRIS; catchments from INCLINE (IIT Mandi) and HydroSHEDS; state boundaries from the Census of India 2011. Analysis, map and charts: ClimMaTech.