
Is the rain above India's hydropower plants changing?
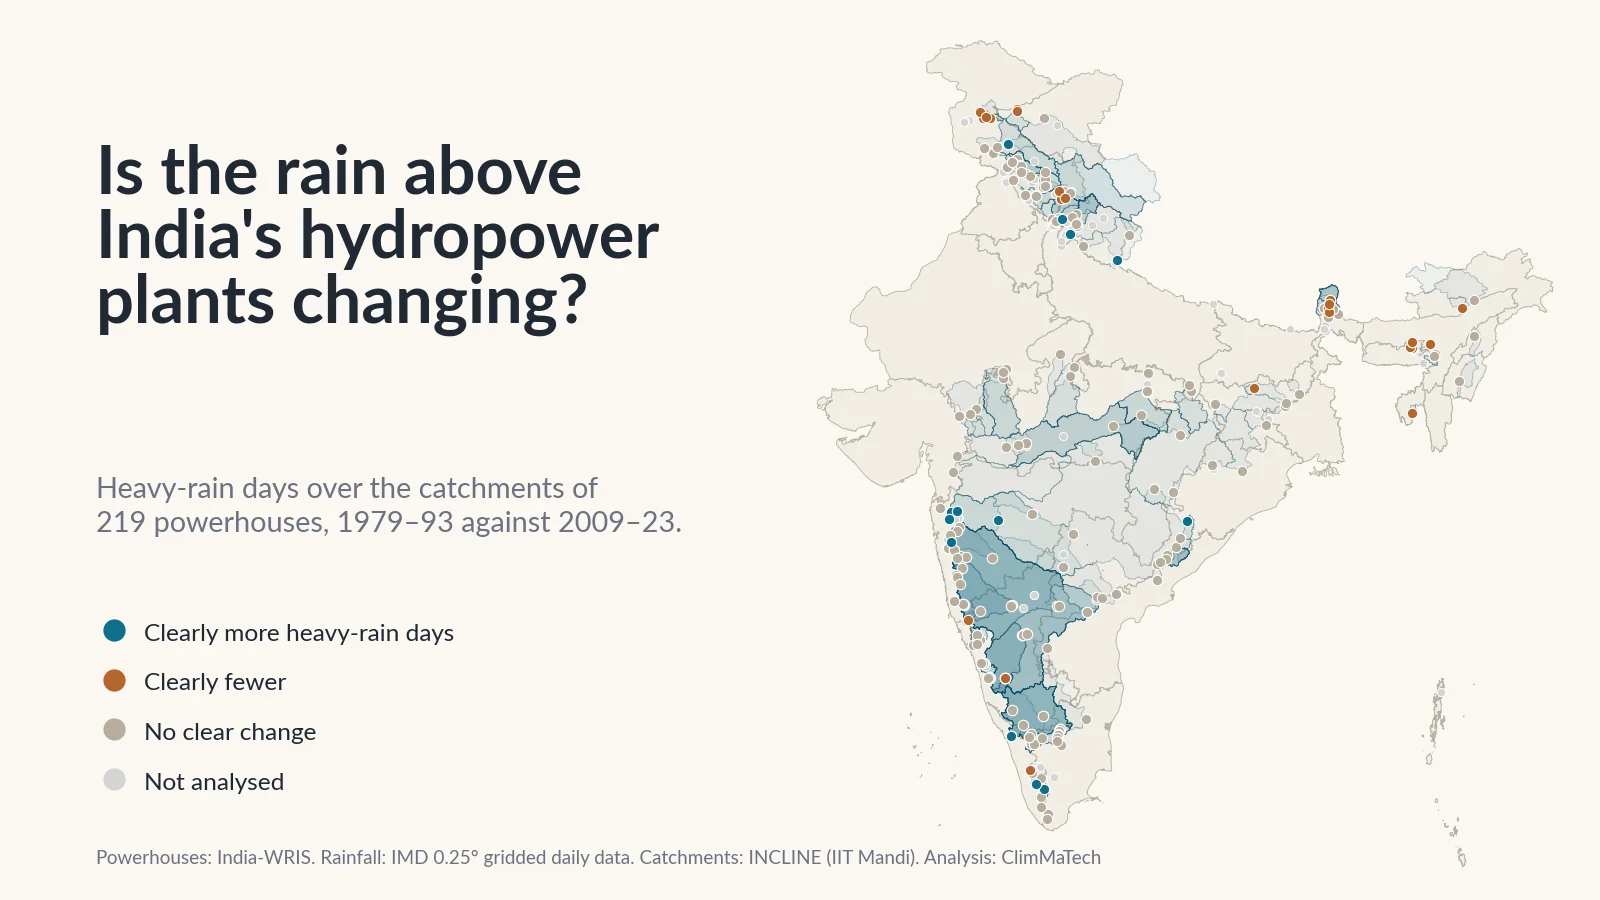
We traced the catchment above each river-fed powerhouse in the national register and compared 45 years of rain over them. Heavy rain has not risen overall. Instead the map has shifted: wetter Western Ghats and peninsula, drier springs in the western Himalaya, fewer heavy days in the Northeast.

A hydropower station lives on rain that falls somewhere else. The water that turns its turbines today fell days, weeks or months ago on hillsides tens or thousands of kilometres upstream: on the Western Ghats above Koyna, on the plateau above Srisailam, on the snowfields above Bhakra. Every station was planned around a record of that rain and the river flow it produced: how much water arrives in a year, how much in the dry months, and how big the floods get.
So it is fair to ask whether that rain is still the rain the stations were built for. You will often hear that it is not, and that heavy rain over the mountains is rising everywhere. We tested the claim.
India-WRIS, the national water resources information system, lists 303 hydropower stations. We traced the land that drains to each one, its catchment, and averaged 45 years of the India Meteorological Department's (IMD) daily gridded rainfall over it. Then we compared the 15 years from 1979 to 1993 with the 15 years from 2009 to 2023.
The short answer: heavy rain has not risen across India's hydropower catchments as a whole. Averaged over the 219 stations we could analyse, a catchment had 2.98 heavy-rain days a year in the early period and 2.97 in the recent one. What has changed is the map. The Western Ghats and much of the peninsula have become clearly wetter. The western Himalaya gets clearly less rain and snow from January to May. Sikkim and the Northeast have fewer heavy-rain days. For a station operator, that regional picture matters more than any national average.
There is a second answer. The rain gauges behind the grid see only part of the water that reaches a Himalayan station, and none of the hazards that have done the most damage to Himalayan hydropower in recent years. We come back to that below.
How we looked
The stations. We started from the India-WRIS powerhouse layer, which gives each station's location, state, river, commissioning year and a few other attributes [1]. It does not give installed capacity, and it does not say whether a station is a storage or a run-of-river scheme. It does say whether the powerhouse sits at the toe of a dam (93 stations), on a canal (42) or elsewhere (88), with 80 not stated.
Where the water comes from. A powerhouse is not always where its water enters. Many Himalayan and Western Ghats stations take water at a dam or weir, carry it through a tunnel and release it kilometres downstream, sometimes into another valley. For Koyna, Dehar, Idukki and several others, our tracing confirms that the dam feeding the station lies outside the powerhouse's own catchment. So wherever we could, we linked each station to the India-WRIS dam or barrage that feeds it, by name and distance, and checked the links by hand [1]. We delineated 242 catchments at the dam or intake that feeds the station, and 19 at the powerhouse itself, where no feeding structure is in the register.
The catchment. We delineated each catchment with INCLINE, the watershed delineation system developed at IIT Mandi [2]. A mapped dam often sits on a bank or a hillside rather than in the channel, so each point was first moved to the nearest channel within 500 m, and the result kept only if its drainage area was plausible; otherwise we searched up to 2–5 km for the larger river and flagged the station. We cross-checked every catchment against a second delineation on the HydroSHEDS flow-direction grid [3]: for half the analysed stations the two areas differ by less than 0.6 %. (Our explainer on delineating a basin from a DEM walks through the steps.)
We left out two groups at this stage. The 42 canal-fed stations take water from headworks far upstream, so the land around them says little about their supply. For 29 stations the delineation failed: the point did not sit near the river that feeds it, the river network has no plausible channel there, or the water reaches the powerhouse from an intake on a side stream that is not in the register.
The rain. IMD's gridded daily rainfall turns readings from thousands of gauges into cells 0.25° (about 25 km) across, with one value per cell per day, from 1979 to 2023 [4][5]. For each catchment we averaged the cells it covers, weighted by area. A large catchment covers hundreds of cells; a small one sits in one or two.
What we measured. For each catchment and each year:
- Annual rain, June–September rain (the south-west monsoon), January–May rain (the dry season before the monsoon, when reservoirs are drawn down) and October–December rain.
- Heavy-rain days: the number of days with 64.5 mm or more, IMD's threshold for heavy rain [6], counted in each grid cell and averaged over the catchment. A catchment value of 2 means the average point in the catchment saw two such days a year. We also counted very heavy days, 115.6 mm or more [6].
- The wettest day: the year's largest daily rain averaged over the whole catchment, after removing isolated single-cell spikes that no neighbouring cell supports.
Then and now. We called a change clear only if the difference between the two 15-year averages is at least twice its standard error, worked out from the station's own year-to-year swings. By chance alone, about 6 of 219 stations would pass that test in each direction. We also ran trend tests over all 45 years [7][8] and corrected them for testing many catchments at once [9][10]. The details are in the Method section at the end.
Which stations count. Five stations, Nathpa Jhakri, Rampur, Karchham Wangtoo and Kashang on the upper Satluj and Stakna on the Indus, have half or more of their catchment in Tibet, outside IMD's grid. We show them on the map but leave them out of the counts. We also set aside eight more whose catchment's annual rain halves or doubles between the periods, a change that points to the gauges rather than the rain. That leaves 219 stations in 182 distinct catchments; several stations share one dam.
Is heavy rain rising over India's hydropower catchments?
Not across the country. Over the 219 stations:
- Heavy-rain days went from 2.98 a year to 2.97. Very heavy days went from 0.65 to 0.60.
- The wettest day of the year averaged 77.1 mm over a catchment in 1979–93 and 79.2 mm in 2009–23.
- Annual rain rose from about 1,548 mm to 1,590 mm, and June–September rain from about 1,115 mm to 1,157 mm.
Station by station, the picture is more mixed:
Fifteen stations have clearly more heavy-rain days and 27 clearly fewer. For very heavy days, 4 rose and 20 fell. Both are well above the 6 each way that chance would give, so these are real changes, but they run in both directions.
Total rain changed far more often. Forty-two stations have clearly wetter years and 31 clearly drier ones. In January to May, 57 are clearly wetter and 32 clearly drier. After correcting for testing 182 catchments, the 45-year trend in annual rain stays significant for 26 catchments rising and 18 falling.
The national answer hides four regional ones, and they point in different directions:
| Region | Plants | Annual rain, mm | June–Sept rain, mm | Jan–May rain, mm | Heavy-rain days | Wettest day, mm |
|---|---|---|---|---|---|---|
| Western Himalaya | 52 | 1,298 → 1,206 (0 up, 14 down) | 667 → 733 (16 up, 4 down) | 521 → 396 (0 up, 26 down) | 1.33 → 1.12 (4 up, 9 down) | 64 → 61 (1 up, 5 down) |
| Eastern Himalaya and Northeast | 23 | 2,868 → 2,498 (1 up, 10 down) | 2,027 → 1,698 (0 up, 9 down) | 630 → 626 (7 up, 6 down) | 5.90 → 3.68 (0 up, 11 down) | 113 → 90 (0 up, 13 down) |
| Western Ghats | 68 | 1,871 → 2,139 (25 up, 1 down) | 1,492 → 1,661 (17 up, 3 down) | 120 → 177 (25 up, 0 down) | 4.90 → 5.77 (9 up, 3 down) | 97 → 111 (19 up, 1 down) |
| Central and peninsular | 76 | 1,030 → 1,088 (16 up, 6 down) | 809 → 834 (10 up, 6 down) | 99 → 115 (25 up, 0 down) | 1.51 → 1.52 (2 up, 4 down) | 58 → 60 (2 up, 1 down) |
Averages over the stations in each region, 1979–93 → 2009–23, with the number of stations whose change is clear in each direction.
Where has the rain changed?
Teal dots on the map have clearly more of the selected measure, brown dots clearly less. Tap a station to see its catchment and both periods.
The Western Ghats: wetter, with bigger wettest days
The clearest change in the country is along the Western Ghats, from Maharashtra to the southern tip of Kerala and Tamil Nadu. Of 68 stations there, 25 have clearly wetter years and only one a clearly drier one. Nineteen have a clearly bigger wettest day, against one smaller. Averaged over the region, annual rain over the catchments went from about 1,871 mm to 2,139 mm, and January–May rain from 120 mm to 177 mm.
The Sharavathi stations in Karnataka show the pattern. Over the catchment of the Linganamakki reservoir, annual rain rose from about 2,427 mm to 3,135 mm, the average wettest day from 98 mm to 141 mm, and January–May rain from 79 mm to 201 mm. The Kalinadi stations above Supa show the same shift on a smaller scale.
Not everything moved one way. Koyna, the best known of the Ghats schemes, shows no clear change: its catchment went from about 1,841 mm a year to 1,993 mm, within its normal swings. Tillari, on the Maharashtra–Goa border, got clearly drier, and monsoon rain over the Peringalkuthu catchment in Kerala fell clearly. Just east of the crest, the Bhadra catchment, which we count as peninsular, got clearly drier too.
Some of the largest rises need care. In the high ranges of Kerala, catchments such as Idukki and Panniyar rise by 59–73 % in annual rain. Idukki's catchment goes from about 1,091 mm to 1,885 mm. A 25 km cell there straddles the wet western slopes and the drier rain-shadow side, and a change in which gauges reported can move such a cell a long way [11]. When we set aside every station whose annual rain changed by more than 40 % either way, the Western Ghats still have 17 stations clearly wetter and none clearly drier. The direction holds; the largest single numbers may not.
Central India and the peninsula: wetter years, wetter dry seasons
Across central India and the peninsula, from the Chambal to the Cauvery, heavy-rain days barely moved (1.51 to 1.52 a year). But 16 of 76 stations have clearly wetter years against 6 drier, and 25 have clearly more January–May rain, with none less.
The three Chambal stations, Gandhi Sagar, Rana Pratap Sagar and Jawahar Sagar, are among the clearest cases. Over the catchment of Gandhi Sagar (22,840 km² as we delineated it; 23,025 km² in a published survey of the reservoir [12]), annual rain rose from about 821 mm to 1,046 mm. Over the Cauvery above Mettur, it rose from about 891 mm to 1,062 mm. Over the Krishna above Srisailam (210,546 km² as we delineated it; 206,030 km² in the India-WRIS record for the dam [13]), January–May rain rose from 64 mm to 90 mm. That is small water in absolute terms, but it falls in the months when the reservoir is lowest.
The exception is the Damodar–Barakar system in Jharkhand and West Bengal. Over Tilaiya, Maithon and Panchet, annual rain fell clearly, at Tilaiya from about 1,296 mm to 992 mm.
The western Himalaya: a drier spring, a wetter monsoon
In the western Himalaya the season matters more than the year. From January to May, 26 of 52 stations get clearly less rain and snow (the grid records snow as its water equivalent), and not one gets more. The regional average fell from about 521 mm to 396 mm. Over the Chenab above Salal, January–May fell from about 684 mm to 533 mm; over the Beas above Pong, from 496 mm to 379 mm.
The monsoon moved the other way. June–September rain is clearly higher at 16 stations and lower at 4. In Uttarakhand, over the Ganga above the Chilla intake at Rishikesh, June–September rain rose from about 835 mm to 1,074 mm and heavy-rain days from 0.66 to 1.28 a year. Over the Bhagirathi above Tehri, June–September rain rose from about 797 mm to 982 mm.
For the year as a whole, 14 stations are clearly drier and none clearly wetter; the drier ones are mostly in Himachal Pradesh, Jammu and Kashmir and Ladakh. In the Ravi valley, annual rain over the Chamera I catchment fell from about 1,625 mm to 1,290 mm.
The stations on the upper Satluj are left out of these counts because half or more of their catchment is in Tibet. Bhakra is counted: over the part of its catchment inside the grid, the pattern is the same, with June–September rain clearly up (443 to 557 mm) and January–May clearly down (475 to 305 mm).
Sikkim and the Northeast: fewer heavy days
The Northeast is the only region where heavy rain clearly fell. Eleven of 23 stations have clearly fewer heavy-rain days, 11 clearly fewer very heavy days and 13 a clearly smaller wettest day; none moved the other way. Over the Teesta above the Teesta III dam in Sikkim, heavy-rain days went from about 3.6 a year to 1.65, and the average wettest day from 99 mm to 73 mm. Yet January–May rain there rose clearly, from about 622 mm to 874 mm.
We treat the largest drops in Meghalaya and Assam with the caution we applied to the Ghats. Over Karbi Langpi, annual rain falls from about 2,678 mm to 1,384 mm. In our cities study we set aside Shillong, where the grid's annual rain fell by more than half, for the same reason: in this region the gauges are few, and the grid's record moves with them [11].
What a rainfall record can't see in the mountains
The Teesta III dam was destroyed on 3 October 2023, but not by rain. A mass of frozen moraine of about 14.7 million m³ fell into South Lhonak Lake, high in the Teesta's headwaters. About 50 million m³ of water burst out, and the flood eroded about 270 million m³ of sediment on its way down the valley [14]. At least 55 people were killed and 70 were reported missing; the flood inundated five hydroelectric plants [15]. Over the same catchment, our rainfall record shows heavy rain falling.
On 7 February 2021, in Chamoli in Uttarakhand, about 27 million m³ of rock and glacier ice broke off Ronti Peak. The debris flow that followed killed or left missing more than 200 people and badly damaged two hydropower projects [16]. It was a collapse of rock and ice, not a rain-driven flood.
On 16–17 June 2013, at Kedarnath, a camp on the Chorabari glacier at 3,820 m recorded 325 mm of rain in 24 hours, and the moraine-dammed Chorabari Lake above the town burst [17]. Our wettest-days study found that the 25 km grid holds far less than that gauge.
These events point to three blind spots in a rainfall record over Himalayan hydropower.
Snow and ice. Of the 83 Himalayan stations we delineated, 47 have at least a fifth of their catchment above 4,000 m, and 56 have catchments that reach above 5,000 m, where glaciers and glacial lakes lie. On the Satluj at Bhakra, a water-balance study put the share of the annual flow from snow and glacier melt at about 59 % [18]. A rainfall grid tells you about the rest. For the seasons and stores that set Himalayan flow, see how winter shapes Himalayan river flow.
High-altitude precipitation. Gauges sit in valleys. In the upper Indus, the precipitation needed to sustain the observed glaciers and river flow is on average more than twice what valley stations and gridded products show, and up to about ten times as much in places [19]. In our own work on Himalayan landslides, the best gridded product against 21 rain gauges had a daily correlation of only 0.40, rising to 0.69 for 30-day totals [20]. A grid can describe a season; it struggles with a day.
Hazards that need no rain. Glacial lake outbursts, rock and ice avalanches and the debris flows they set off can come on a dry day. The national guidelines on glacial lake outburst floods (GLOFs) find the threat to hydropower highest in Sikkim [21]. Our explainer on how GLOFs are watched covers the monitoring.
What does this mean for hydropower operators?
The point is not that every station faces more rain. It is that the rain behind many stations is no longer the rain in the record they were planned on. Of the 114 analysed stations commissioned by 1993, 27 now see clearly wetter years and 11 clearly drier ones, and 19 have clearly more heavy-rain days, more very heavy days or a bigger wettest day. Across all 219 stations, 30 show a clear rise in at least one of those three measures of heavy rain, 22 of them in the Western Ghats.
Inflow forecasting. A forecast built on 1980s rainfall–inflow relations will drift where the rain has shifted, wetter in the Ghats and the peninsula, drier in the western Himalayan spring. The fix is to keep re-fitting forecasts to recent observed inflows and catchment rain. Where a catchment has few or no gauges, data-driven models can help: in our study of 144 Indian catchments, a model designed for ungauged basins matched the skill of one that relies on observed flow [22]. But no model replaces measurements upstream. See what dam operators need to measure.
Spillway and gate operations. Where the wettest day has grown, as along the Ghats, gates may face larger inflows from a single storm than the operating rules assumed. Release decisions depend on knowing the reservoir level and the inflow in real time, not once or twice a day; see how spillways and gates work.
Sediment. Heavy rain and debris flows move sediment, and the Teesta flood showed how much: the sediment it eroded on the way down overwhelmed the infrastructure in its path [14]. Sediment eats storage and wears turbines. Our explainer on why reservoirs lose storage covers the processes.
Safety under the Dam Safety Act. The Dam Safety Act, 2021 asks the owner of every specified dam to set up a hydro-meteorological station near the dam, a hydro-meteorological network with an inflow forecasting system, and an emergency flood warning system for the areas downstream. It also makes a review of design floods part of every comprehensive safety evaluation [23]. Our results suggest where that review should start: catchments whose rain has clearly changed since the design data were collected. See what the Act asks of dam owners and districts and our case study on India's ageing dams.
What would help
- Rain and level stations inside the catchment, not only at the dam. A 25 km grid built from valley gauges is the wrong instrument for a Himalayan headwater. Recording rain gauges at several altitudes, and water-level stations on the main tributaries, show the inflow hours before it reaches the reservoir.
- Discharge, not just level, at the head of the reservoir and below the dam. Inflow forecasting needs flow, and non-contact methods can measure it in steep, debris-laden rivers where instruments in the water are hard to keep working. See river monitoring in hill and Himalayan catchments.
- Real-time telemetry from all of these to the control room, so that the operator sees a rising tributary within minutes, as described in what an RTDAS is.
- Watching what rain gauges cannot: glacial lakes, unstable slopes and snowpack above the high-mountain stations, as the GLOF guidelines recommend [21].
- Warnings that reach people downstream. A flash flood or an outburst can reach a powerhouse and the villages below it in less time than a phone tree takes. Sirens and voice messages along the valley, tied to the upstream stations, buy that time; see flash floods and warning time.
Key points
- Of the 303 hydropower stations in the India-WRIS register, we analysed 219. The rest are canal-fed (42), could not be delineated (29), have half or more of their catchment outside India's rainfall grid (5) or have an unreliable grid record (8 more).
- Heavy rain has not risen over India's hydropower catchments as a whole: 2.98 heavy-rain days a year in 1979–93, 2.97 in 2009–23. Fifteen stations have clearly more, 27 clearly fewer.
- The rain has shifted by region. The Western Ghats are clearly wetter (25 of 68 stations), with bigger wettest days (19). The peninsula has wetter years and wetter January–May seasons. The western Himalaya has drier springs (26 of 52) but wetter monsoons (16). Sikkim and the Northeast have fewer heavy days (11 of 23).
- Some of the largest changes, in Kerala's high ranges and Meghalaya, may partly reflect changes in the gauges behind the grid. The regional directions hold when we leave them out.
- For Himalayan stations, rainfall describes only part of the water and none of the snow, ice, glacial-lake or rock-avalanche hazards. Chamoli 2021 and Teesta III 2023 were not rainfall events.
- Inflow forecasts and design-flood reviews should be re-fitted to recent rain, with gauges, level and flow stations upstream and warnings that reach people downstream.
At ClimMaTech we build instruments for this kind of monitoring. Tarang, our radar automatic water level recorder (AWLR), measures reservoir and river levels without touching the water. PRAVAAH is both an AWLR and a surface velocity radar (SVR): a non-contact discharge sensor that, with a surveyed cross-section and a site-calibrated coefficient, measures river discharge without touching the water, including in steep rivers that carry debris. RAKSHAK is a multi-hazard warning siren with 15–20 user-selectable siren tones and voice messages, for flood and outburst alerts downstream, warnings of other disasters and civil-defence signals.
Method
Stations: India-WRIS powerhouse layer, 303 points, with name, state, river, location type, powerhouse type and commissioning year (45 stations have none) [1]. The layer has a size class but no installed capacity, and no field for storage or run-of-river operation. Ladakh stations are filed under Jammu and Kashmir in the layer.
Intakes: India-WRIS dam (5,619 points) and barrage, weir and anicut (1,102 points) layers [1]. A dam or barrage within 40 km whose name shares a distinctive word with the powerhouse name was linked to it. For 104 stations the links were set by hand from the names and positions: to fix links to the wrong stage of a cascade or to a structure downstream, to add reservoirs that feed a station across a divide (for example Pandoh for Dehar, Mulshi for Bhira and Linganamakki for Sharavathi), and to place the outlet at the dam, barrage or intake rather than the powerhouse wherever the register holds the feeding structure. Nineteen stations have no feeding structure in the register and were delineated at the powerhouse; three of them are analysed (Mahi II, Rammam II and Tangnu Romai). Canal-drop stations (42) were not delineated.
Catchments: delineated with INCLINE, the watershed delineation system developed at IIT Mandi [2]. Each dam, barrage or intake point (or powerhouse, where no feeding structure is in the register) was snapped to the nearest channel within 500 m, and the result accepted if its drainage area was within a factor of 1.5 of an independent delineation at the same point on the HydroSHEDS 15-arc-second flow directions [3], itself checked against the HydroBASINS sub-basins [24]; otherwise the nearest channel within 1.5 km, then the largest channel within 2 km and 5 km, flagged as a wide snap (16 points). Points with no plausible snap were failures. A station's catchment is the union of its intakes' catchments; its area is the geodesic area of that union. Twenty-nine stations were flagged as failures and left out: no plausible snap (including the Uri, Lower Jhelum and Vishnuprayag intakes, where the network gives a much smaller drainage area than the river's), a catchment under 25 km², or an intake on a side stream that is not in the register (Parbati II, Sorang, Thirot and Singoli Bhatwari). Across the 219 analysed stations, the INCLINE and HydroSHEDS areas differ by a median of 0.6 % and by more than 10 % at 13. On the Satluj, INCLINE leaves out the basin of Lakes Manasarovar and Rakshastal in Tibet, which drains to the river only at high water, so its area at Bhakra (44,941 km²) is smaller than the HydroSHEDS area (52,631 km²) and the published 56,980 km² [13]. Elevation shares are from the MERIT digital elevation model [25].
Published areas: Our areas come from river networks derived from satellite elevation data and may differ from published areas, which come from survey maps or project reports. Where a primary source gives a figure, the map shows it beside ours: archived India-WRIS dam pages [13], a published survey for Gandhi Sagar [12] and the operating company for Upper Indravati [26]. For the 70 analysed stations with a published area, the median difference is 1.8 %; 12 differ by more than 10 %, mostly small Western Ghats and Nilgiri reservoirs where intakes, forebays and transfers make the published figure hard to match. Two India-WRIS entries were not used: Ranjit Sagar (60,860 km², ten times the river's area at the dam) and Tehri (7,511 in a field labelled thousand hectares).
Rainfall data: IMD 0.25° × 0.25° gridded daily rainfall [4][5], 1 January 1979 to 31 December 2023. IMD provides the data for download, asks users to cite Pai et al. (2014) and states that it cannot guarantee the data are correct in all circumstances. A grid cell is usable if it has a complete record in at least 40 of the 45 years (4,964 cells).
Catchment rainfall: For each day, the area-weighted mean of the usable cells under the catchment; summed to calendar-year, June–September, January–May and October–December totals. Coverage is the share of the catchment's area in usable cells. Stations with coverage below 50 % (5, all with catchments mainly in Tibet) are shown but not counted.
Measures: heavy-rain days (64.5 mm or more) and very heavy days (115.6 mm or more) [6] counted per cell and year and averaged over the catchment's cells; a cell-year with a missing day is left out of that year's average. Wettest day: the year's largest catchment-average daily rain, after capping any cell-day that no neighbouring cell supports (none of its eight neighbours had at least half as much) at twice the largest neighbouring value; this affected 0.32 % of cell-days.
Screening: stations whose catchment-average annual rain halves or doubles between the periods are shown but not counted (Aliyar, Sholayar I and II, Umiam I and II, Myntdu, Bandardhara I and II, and Stakna).
Clear change: the difference between the 2009–2023 and 1979–1993 means is at least twice its standard error, SE = √(s₁²/15 + s₂²/15). Shuffling the 30 years between the two periods 500 times per catchment showed the rule passes about 2.5 % of catchments in each direction by chance. Sensitivity test: the same counts without stations whose annual rain changed by more than 40 %.
Trend tests: Mann–Kendall test with tie correction [7] and Sen's slope [8] on each distinct catchment's 1979–2023 series; false discovery rate controlled with the Benjamini–Hochberg procedure [9] at 0.10 across the 182 distinct catchments, as recommended by Wilks [10]. The tests do not correct for serial correlation.
Regions: western Himalaya (Jammu and Kashmir, Ladakh, Himachal Pradesh, Uttarakhand, or a catchment centred north of 29.5° N and west of 81° E); eastern Himalaya and Northeast (Sikkim and the north-eastern states, or a West Bengal station with its catchment centred north of 26.5° N); Western Ghats (Kerala, Goa, or a catchment centred south of 21.5° N on the western side of the Ghats); central and peninsular (the rest).
Caveats: A 0.25° daily grid smooths out local and short rain and is built from gauges whose network changes over time [4][11]; in mountains it misses much of the high-altitude precipitation [19]. Delineated catchments follow the river network as mapped from satellite data, and intake links may be wrong for some cascades and trans-basin schemes. Rainfall is not river flow: snow and glacier melt, evaporation, groundwater and upstream regulation all sit between them. Two 15-year periods do not separate long-term change from decadal swings. Stations that share a catchment are not independent. Maps are approximate and not to scale; catchment outlines extend beyond India's boundary where rivers rise outside it.
References
- India-WRIS, Ministry of Jal Shakti, Powerhouses, Dams and Barrages/Weirs/Anicuts (water resources projects layers). https://indiawris.gov.in/wris/
- Barbhuiya, S. and Gupta, V., INCLINE watershed delineation system, Indian Institute of Technology Mandi, 2026; river network from GRIT (Wortmann et al., 2025, Water Resources Research, doi:10.1029/2024WR038308; CC BY-NC 4.0).
- Lehner, B., Verdin, K. and Jarvis, A., New global hydrography derived from spaceborne elevation data, Eos, Transactions American Geophysical Union 89(10), 93–94, 2008. https://doi.org/10.1029/2008EO100001; data: HydroSHEDS. https://www.hydrosheds.org
- Pai, D.S., Sridhar, L., Rajeevan, M., Sreejith, O.P., Satbhai, N.S. and Mukhopadhyay, B., Development of a new high spatial resolution (0.25° × 0.25°) long period (1901–2010) daily gridded rainfall data set over India and its comparison with existing data sets over the region, Mausam 65(1), 1–18, 2014. https://doi.org/10.54302/mausam.v65i1.851
- India Meteorological Department, Pune, High resolution (0.25 × 0.25 degree) gridded daily rainfall data (NetCDF), IMD. https://www.imdpune.gov.in/cmpg/Griddata/Rainfall_25_NetCDF.html
- India Meteorological Department, RSMC New Delhi, Press release, 2 March 2022 (legend of rainfall intensity terms: heavy 64.5–115.5 mm, very heavy 115.6–204.4 mm), IMD, 2022. https://rsmcnewdelhi.imd.gov.in/uploads/archive/8/8_605370_Press%20Release%2002.03.2022_1.pdf
- Mann, H.B., Nonparametric tests against trend, Econometrica 13(3), 245–259, 1945. https://doi.org/10.2307/1907187
- Sen, P.K., Estimates of the regression coefficient based on Kendall's tau, Journal of the American Statistical Association 63(324), 1379–1389, 1968. https://doi.org/10.1080/01621459.1968.10480934
- Benjamini, Y. and Hochberg, Y., Controlling the false discovery rate: a practical and powerful approach to multiple testing, Journal of the Royal Statistical Society Series B 57(1), 289–300, 1995. https://doi.org/10.1111/j.2517-6161.1995.tb02031.x
- Wilks, D.S., "The stippling shows statistically significant grid points": how research results are routinely overstated and overinterpreted, and what to do about it, Bulletin of the American Meteorological Society 97(12), 2263–2273, 2016. https://doi.org/10.1175/BAMS-D-15-00267.1
- Lin, M. and Huybers, P., If rain falls in India and no one reports it, are historical trends in monsoon extremes biased?, Geophysical Research Letters 46(3), 1681–1689, 2019. https://doi.org/10.1029/2018GL079709
- Rao, K.S., Kartha, K.N., Gupta, D.R., Pandya, S.S. and Iyer, H.K., Studies on morphometry and hydrology of Gandhisagar reservoir with special reference to its fisheries, Fishery Technology 25(1), 1988. https://epubs.icar.org.in/index.php/FT/article/view/72344
- India-WRIS, Water resources project information (dam pages, field "Catchment Area"), archived copies 2013–2018; for example Srisailam (N.S.R.S.P) Dam D00557, archived 4 March 2016. https://web.archive.org/web/20160304125447/http://india-wris.nrsc.gov.in/wrpinfo/index.php?title=Srisailam(N.S.R.S.P)_Dam_D00557_Dam_D00557)
- Sattar, A., Cook, K.L., Rai, S.K. and others, The Sikkim flood of October 2023: drivers, causes, and impacts of a multihazard cascade, Science 387(6740), eads2659, 2025. https://doi.org/10.1126/science.ads2659; accepted manuscript: https://eprints.whiterose.ac.uk/id/eprint/224098/
- University of Zurich, Department of Geography, Sikkim flood disaster, 2025. https://geo.uzh.ch/en/news/papers/2025/sikkim-flood-disaster.html
- Shugar, D.H., Jacquemart, M., Shean, D., Bhushan, S., Upadhyay, K. and others, A massive rock and ice avalanche caused the 2021 disaster at Chamoli, Indian Himalaya, Science 373(6552), 300–306, 2021. https://doi.org/10.1126/science.abh4455; accepted manuscript: https://eprints.whiterose.ac.uk/id/eprint/175202/
- Dobhal, D.P., Gupta, A.K., Mehta, M. and Khandelwal, D.D., Kedarnath disaster: facts and plausible causes, Current Science 105(2), 171–174, 2013. https://www.currentscience.ac.in/Volumes/105/02/0171.pdf
- Singh, P. and Jain, S.K., Snow and glacier melt in the Satluj River at Bhakra Dam in the western Himalayan region, Hydrological Sciences Journal 47(1), 93–106, 2002. https://doi.org/10.1080/02626660209492910
- Immerzeel, W.W., Wanders, N., Lutz, A.F., Shea, J.M. and Bierkens, M.F.P., Reconciling high-altitude precipitation in the upper Indus basin with glacier mass balances and runoff, Hydrology and Earth System Sciences 19, 4673–4687, 2015. https://doi.org/10.5194/hess-19-4673-2015
- Sharma, S., Barbhuiya, S., Das, S., Gupta, V. and Uday, K.V., Dynamic modelling of landslide susceptibility in response to hydro-meteorological variability in the Himalayas, Scientific Reports 16, 19885, 2026. https://doi.org/10.1038/s41598-026-43919-5
- National Disaster Management Authority, National Disaster Management Authority Guidelines: Management of Glacial Lake Outburst Floods (GLOFs), NDMA, Government of India, October 2020. https://ndma.gov.in/sites/default/files/PDF/Guidelines/Guidelines-on-Management-of-GLOFs.pdf
- Barbhuiya, S. and Gupta, V., From gauged to ungauged: large-scale deep learning rainfall-runoff modelling for reliable streamflow estimation in India's diverse basins, Environmental Modelling & Software 194, 106696, 2025. https://doi.org/10.1016/j.envsoft.2025.106696
- Government of India, The Dam Safety Act, 2021 (No. 41 of 2021), sections 33, 35 and 38, Gazette of India, 14 December 2021; copy published by the Central Water Commission. https://www.cwc.gov.in/sites/default/files/booklet.pdf
- Lehner, B. and Grill, G., Global river hydrography and network routing: baseline data and new approaches to study the world's large river systems, Hydrological Processes 27(15), 2171–2186, 2013. https://doi.org/10.1002/hyp.9740
- Yamazaki, D., Ikeshima, D., Tawatari, R., Yamaguchi, T., O'Loughlin, F., Neal, J.C. and others, A high-accuracy map of global terrain elevations, Geophysical Research Letters 44(11), 5844–5853, 2017. https://doi.org/10.1002/2017GL072874
- Odisha Hydro Power Corporation, Upper Indravati Power Station, Mukhiguda (project overview, "Catchment Area 2630 Sq. Km."), OHPC. https://www.ohpc.co.in/project/projects-overview/upper-indravati-hydro-electric-project-mukhiguda/
Data credits: rainfall data from the India Meteorological Department; powerhouse, dam and barrage locations from India-WRIS; catchments delineated with INCLINE (IIT Mandi); comparison flow directions from HydroSHEDS (WWF); elevation from MERIT DEM; state boundaries from the Census of India 2011. Analysis, map and charts: ClimMaTech.